29
/es/
es
AIzaSyAYiBZKx7MnpbEhh9jyipgxe19OcubqV5w
April 1, 2024
72648
Australia
AUS
true
2
1
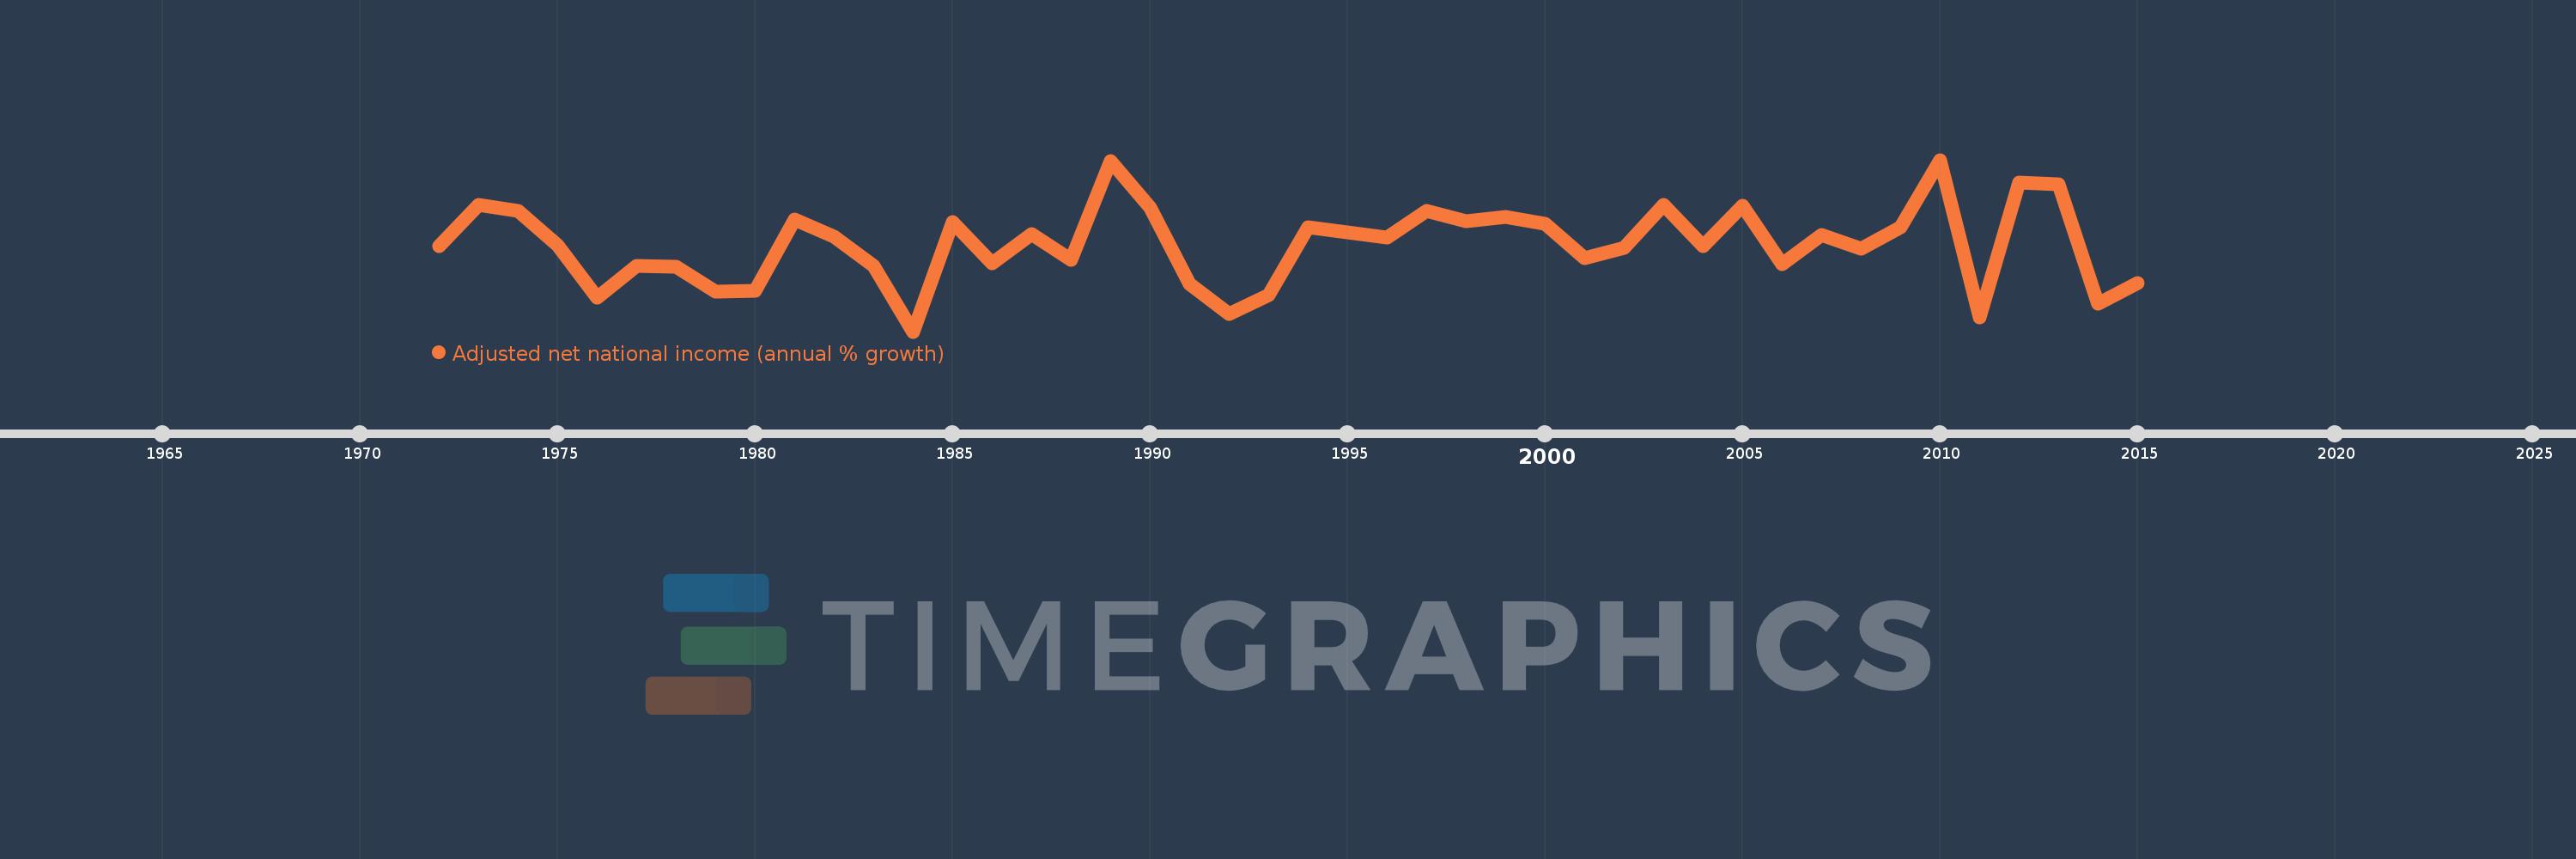
Adjusted net national income (annual % growth)
2015,2014,2013,2012,2011,2010,2009,2008,2007,2006,2005,2004,2003,2002,2001,2000,1999,1998,1997,1996,1995,1994,1993,1992,1991,1990,1989,1988,1987,1986,1985,1984,1983,1982,1981,1980,1979,1978,1977,1976,1975,1974,1973,1972
Estas estadísticas en otros países:
línea de tiempo (timeline):
En esta escala de tiempo se presenta un gráfico de 1972 y 2015 de Australia. Los datos de 1971 están ausentes. El número de observaciones reales por fecha: 44.
Fuente (nombre):
Indicadores del desarrollo mundial
Fuente (organización):
World Bank staff estimates based on sources and methods in World Bank's "The Changing Wealth of Nations: Measuring Sustainable Development in the New Millennium" (2011).
Categorías:
Economy & Growth
Se ha actualizado:
23 abr 2017 año
Los indicadores de los cambios de valor en los últimos años
Mínimo:
-1.021
1 ene 1984 año
Máximo:
7.167
1 ene 2010 año
A la fecha de observación
Valor
Cambio absoluto
El cambio con respecto al valor anterior
1 ene 1972 año
3.066
+3.066
0.0%
1 ene 1973 año
5.027
+1.961
63.96%
1 ene 1974 año
4.744
-0.284
-5.64%
1 ene 1975 año
3.102
-1.642
-34.61%
1 ene 1976 año
0.604
-2.497
-80.51%
1 ene 1977 año
2.115
+1.51
249.89%
1 ene 1978 año
2.059
-0.056
-2.64%
1 ene 1979 año
0.865
-1.195
-58.01%
1 ene 1980 año
0.941
+0.076
8.81%
1 ene 1981 año
4.328
+3.387
359.99%
1 ene 1982 año
3.498
-0.829
-19.16%
1 ene 1983 año
2.117
-1.382
-39.49%
1 ene 1984 año
-1.021
-3.137
-148.21%
1 ene 1985 año
4.192
+5.213
-510.78%
1 ene 1986 año
2.222
-1.971
-47.0%
1 ene 1987 año
3.64
+1.419
63.86%
1 ene 1988 año
2.393
-1.248
-34.27%
1 ene 1989 año
7.087
+4.694
196.16%
1 ene 1990 año
4.893
-2.194
-30.95%
1 ene 1991 año
1.236
-3.657
-74.74%
1 ene 1992 año
-0.193
-1.429
-115.63%
1 ene 1993 año
0.72
+0.913
-472.52%
1 ene 1994 año
3.949
+3.229
448.62%
1 ene 1995 año
3.69
-0.259
-6.56%
1 ene 1996 año
3.465
-0.225
-6.11%
1 ene 1997 año
4.75
+1.285
37.09%
1 ene 1998 año
4.249
-0.501
-10.56%
1 ene 1999 año
4.435
+0.186
4.38%
1 ene 2000 año
4.125
-0.309
-6.98%
1 ene 2001 año
2.482
-1.643
-39.82%
1 ene 2002 año
2.963
+0.481
19.36%
1 ene 2003 año
5.027
+2.064
69.66%
1 ene 2004 año
3.04
-1.988
-39.54%
1 ene 2005 año
4.963
+1.923
63.27%
1 ene 2006 año
2.181
-2.782
-56.05%
1 ene 2007 año
3.601
+1.42
65.1%
1 ene 2008 año
2.92
-0.681
-18.92%
1 ene 2009 año
3.971
+1.051
36.01%
1 ene 2010 año
7.167
+3.195
80.45%
1 ene 2011 año
-0.329
-7.496
-104.59%
1 ene 2012 año
6.098
+6.428
-1.95 mil%
1 ene 2013 año
5.992
-0.106
-1.74%
1 ene 2014 año
0.316
-5.676
-94.72%
1 ene 2015 año
1.306
+0.989
312.59%
Ranking de los países por los datos estadísticos actuales


Comentarios: