29
/es/
es
AIzaSyAYiBZKx7MnpbEhh9jyipgxe19OcubqV5w
April 1, 2024
62282
Upper middle income
UMC
false
2
1
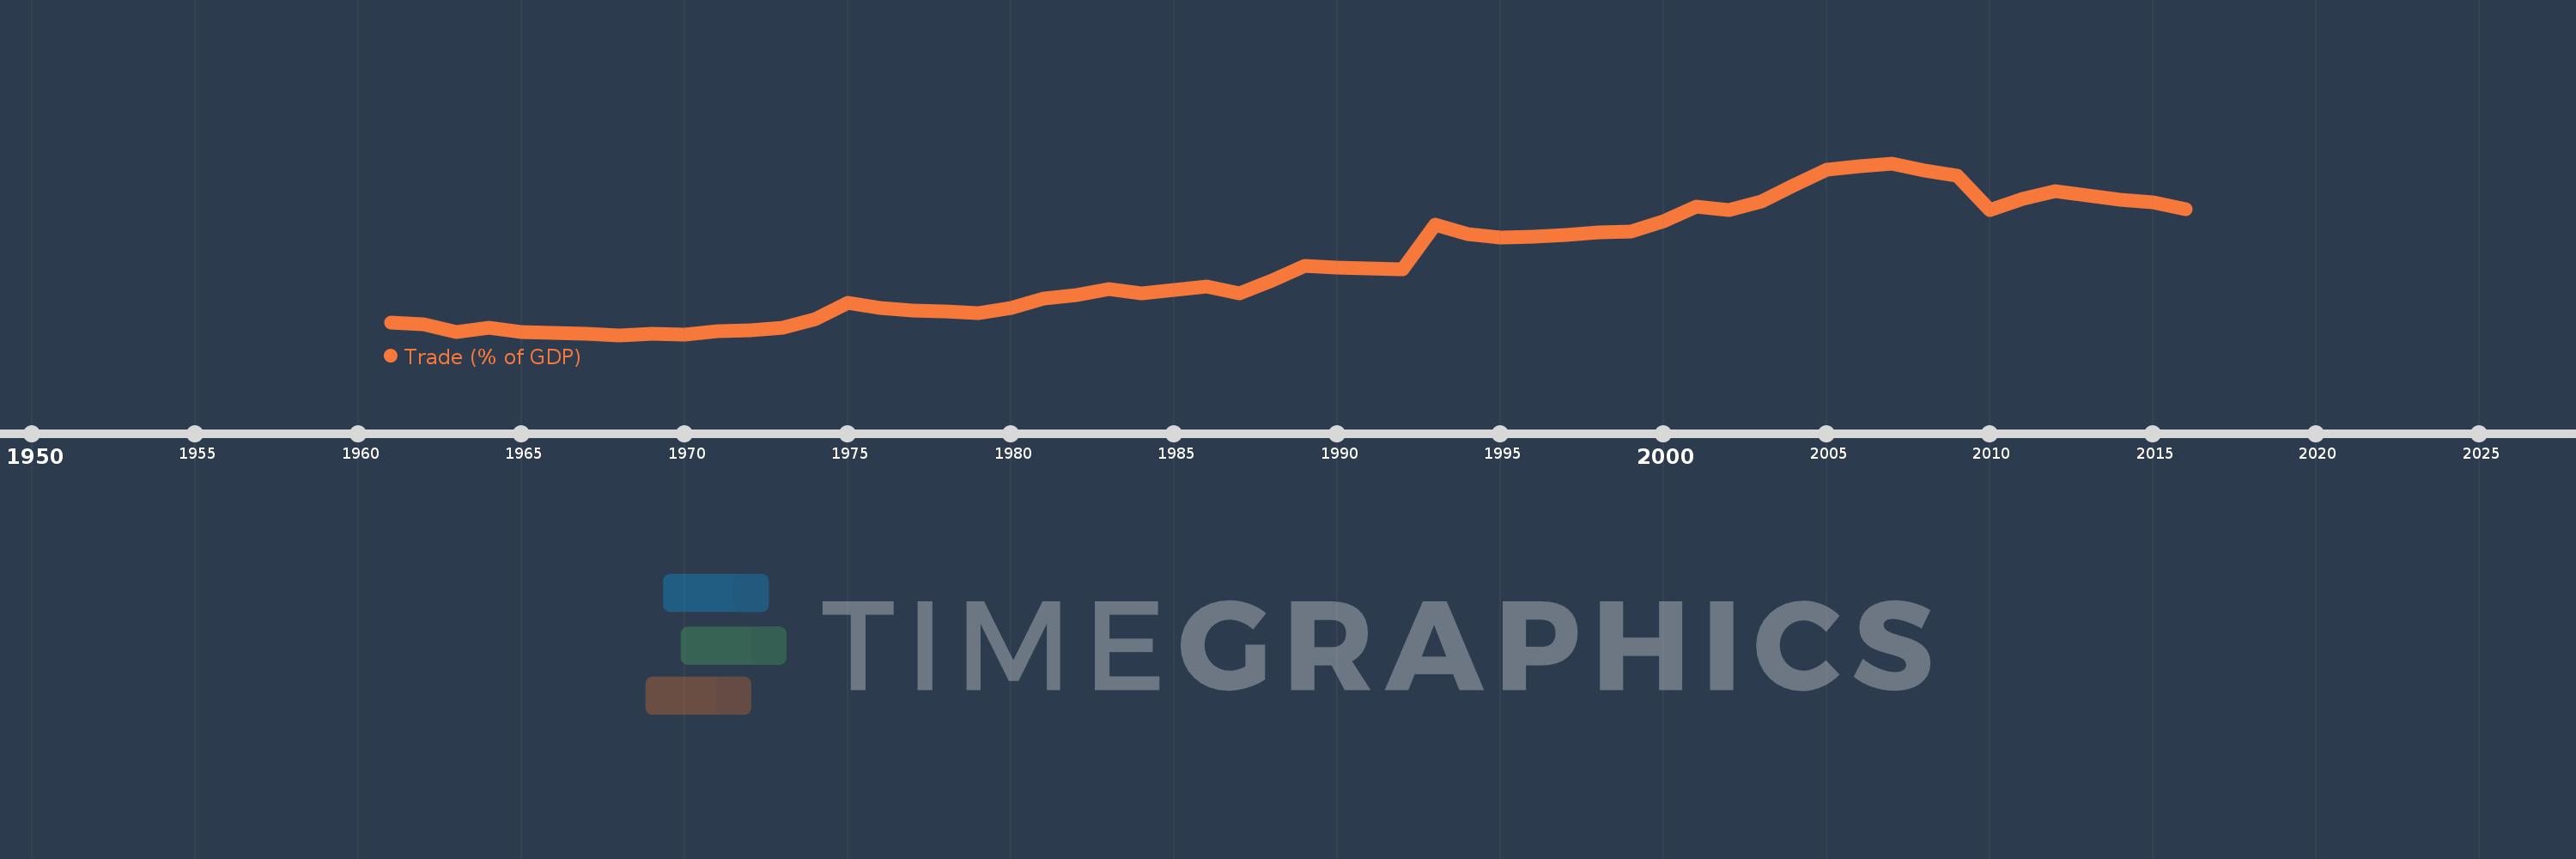
Trade (% of GDP)
2016,2015,2014,2013,2012,2011,2010,2009,2008,2007,2006,2005,2004,2003,2002,2001,2000,1999,1998,1997,1996,1995,1994,1993,1992,1991,1990,1989,1988,1987,1986,1985,1984,1983,1982,1981,1980,1979,1978,1977,1976,1975,1974,1973,1972,1971,1970,1969,1968,1967,1966,1965,1964,1963,1962,1961
Estas estadísticas en otros países:
AfghanistanAlbaniaAlgeriaAngolaAntigua and BarbudaArab WorldArgentinaArmeniaArubaAustraliaAustriaAzerbaijanBahamas, TheBahrainBangladeshBarbadosBelarusBelgiumBelizeBeninBermudaBhutanBoliviaBosnia and HerzegovinaBotswanaBrazilBrunei DarussalamBulgariaBurkina FasoBurundiCabo VerdeCambodiaCameroonCanadaCaribbean small statesCentral African RepublicCentral Europe and the BalticsChadChileChinaColombiaComorosCongo, Dem. Rep.Congo, Rep.Costa RicaCote d'IvoireCroatiaCubaCyprusCzech RepublicDenmarkDjiboutiDominicaDominican RepublicEarly-demographic dividendEast Asia & PacificEast Asia & Pacific (excluding high income)East Asia & Pacific (IDA & IBRD countries)EcuadorEgypt, Arab Rep.El SalvadorEquatorial GuineaEritreaEstoniaEthiopiaEuro areaEurope & Central AsiaEurope & Central Asia (excluding high income)Europe & Central Asia (IDA & IBRD countries)European UnionFaroe IslandsFijiFinlandFragile and conflict affected situationsFranceFrench PolynesiaGabonGambia, TheGeorgiaGermanyGhanaGreeceGrenadaGuatemalaGuineaGuinea-BissauGuyanaHaitiHeavily indebted poor countries (HIPC)High incomeHondurasHong Kong SAR, ChinaHungaryIBRD onlyIcelandIDA & IBRD totalIDA blendIDA onlyIDA totalIndiaIndonesiaIran, Islamic Rep.IraqIrelandIsraelItalyJamaicaJapanJordanKazakhstanKenyaKiribatiKorea, Rep.KosovoKuwaitKyrgyz RepublicLao PDRLate-demographic dividendLatin America & Caribbean Latin America & Caribbean (excluding high income)Latin America & the Caribbean (IDA & IBRD countries)LatviaLeast developed countries: UN classificationLebanonLesothoLiberiaLibyaLithuaniaLow & middle incomeLow incomeLower middle incomeLuxembourgMacao SAR, ChinaMacedonia, FYRMadagascarMalawiMalaysiaMaldivesMaliMaltaMauritaniaMauritiusMexicoMicronesia, Fed. Sts.Middle East & North AfricaMiddle East & North Africa (excluding high income)Middle East & North Africa (IDA & IBRD countries)Middle incomeMoldovaMongoliaMontenegroMoroccoMozambiqueMyanmarNamibiaNepalNetherlandsNew CaledoniaNew ZealandNicaraguaNigerNigeriaNorth AmericaNorwayOECD membersOmanOther small statesPacific island small statesPakistanPalauPanamaPapua New GuineaParaguayPeruPhilippinesPolandPortugalPost-demographic dividendPre-demographic dividendPuerto RicoQatarRomaniaRussian FederationRwandaSamoaSaudi ArabiaSenegalSerbiaSeychellesSierra LeoneSingaporeSlovak RepublicSloveniaSmall statesSolomon IslandsSomaliaSouth AfricaSouth AsiaSouth Asia (IDA & IBRD)South SudanSpainSri LankaSt. Kitts and NevisSt. LuciaSt. Vincent and the GrenadinesSub-Saharan Africa Sub-Saharan Africa (excluding high income)Sub-Saharan Africa (IDA & IBRD countries)SudanSurinameSwazilandSwedenSwitzerlandSyrian Arab RepublicTajikistanTanzaniaThailandTimor-LesteTogoTongaTrinidad and TobagoTunisiaTurkeyTurkmenistanUgandaUkraineUnited Arab EmiratesUnited KingdomUnited StatesUpper middle incomeUruguayUzbekistanVanuatuVenezuela, RBVietnamWest Bank and GazaWorldYemen, Rep.ZambiaZimbabwe línea de tiempo (timeline):
En esta escala de tiempo se presenta un gráfico de 1961 y 2016 de Upper middle income. Los datos de 1960 están ausentes. El número de observaciones reales por fecha: 56.
Fuente (nombre):
Indicadores del desarrollo mundial
Fuente (organización):
World Bank national accounts data, and OECD National Accounts data files.
Categorías:
Economy & Growth, Trade
Se ha actualizado:
23 abr 2017 año
Los indicadores de los cambios de valor en los últimos años
Mínimo:
15.795
1 ene 1968 año
Máximo:
62.006
1 ene 2007 año
A la fecha de observación
Valor
Cambio absoluto
El cambio con respecto al valor anterior
1 ene 1961 año
19.125
+19.125
0.0%
1 ene 1962 año
18.581
-0.545
-2.85%
1 ene 1963 año
16.637
-1.943
-10.46%
1 ene 1964 año
17.793
+1.155
6.94%
1 ene 1965 año
16.546
-1.247
-7.01%
1 ene 1966 año
16.412
-0.133
-0.81%
1 ene 1967 año
16.248
-0.165
-1.0%
1 ene 1968 año
15.795
-0.453
-2.79%
1 ene 1969 año
16.151
+0.357
2.26%
1 ene 1970 año
15.895
-0.257
-1.59%
1 ene 1971 año
16.772
+0.878
5.52%
1 ene 1972 año
17.077
+0.305
1.82%
1 ene 1973 año
17.721
+0.644
3.77%
1 ene 1974 año
20.029
+2.308
13.02%
1 ene 1975 año
24.369
+4.34
21.67%
1 ene 1976 año
23.03
-1.339
-5.5%
1 ene 1977 año
22.306
-0.724
-3.14%
1 ene 1978 año
22.099
-0.207
-0.93%
1 ene 1979 año
21.648
-0.451
-2.04%
1 ene 1980 año
23.054
+1.407
6.5%
1 ene 1981 año
25.61
+2.555
11.08%
1 ene 1982 año
26.548
+0.938
3.66%
1 ene 1983 año
28.097
+1.549
5.83%
1 ene 1984 año
26.949
-1.148
-4.08%
1 ene 1985 año
27.889
+0.94
3.49%
1 ene 1986 año
28.927
+1.038
3.72%
1 ene 1987 año
26.944
-1.983
-6.85%
1 ene 1988 año
30.453
+3.508
13.02%
1 ene 1989 año
34.455
+4.002
13.14%
1 ene 1990 año
33.855
-0.6
-1.74%
1 ene 1991 año
33.669
-0.186
-0.55%
1 ene 1992 año
33.536
-0.133
-0.39%
1 ene 1993 año
45.501
+11.966
35.68%
1 ene 1994 año
42.976
-2.526
-5.55%
1 ene 1995 año
42.11
-0.865
-2.01%
1 ene 1996 año
42.231
+0.121
0.29%
1 ene 1997 año
42.62
+0.389
0.92%
1 ene 1998 año
43.489
+0.869
2.04%
1 ene 1999 año
43.639
+0.15
0.34%
1 ene 2000 año
46.469
+2.83
6.48%
1 ene 2001 año
50.395
+3.926
8.45%
1 ene 2002 año
49.52
-0.875
-1.74%
1 ene 2003 año
51.77
+2.25
4.54%
1 ene 2004 año
56.131
+4.361
8.42%
1 ene 2005 año
60.228
+4.097
7.3%
1 ene 2006 año
61.214
+0.986
1.64%
1 ene 2007 año
62.006
+0.793
1.29%
1 ene 2008 año
60.079
-1.927
-3.11%
1 ene 2009 año
58.746
-1.333
-2.22%
1 ene 2010 año
49.443
-9.303
-15.84%
1 ene 2011 año
52.391
+2.947
5.96%
1 ene 2012 año
54.438
+2.048
3.91%
1 ene 2013 año
53.361
-1.077
-1.98%
1 ene 2014 año
52.142
-1.219
-2.28%
1 ene 2015 año
51.527
-0.615
-1.18%
1 ene 2016 año
49.707
-1.82
-3.53%
Ranking de los países por los datos estadísticos actuales


Comentarios: