29
/es/
es
AIzaSyAYiBZKx7MnpbEhh9jyipgxe19OcubqV5w
April 1, 2024
30362
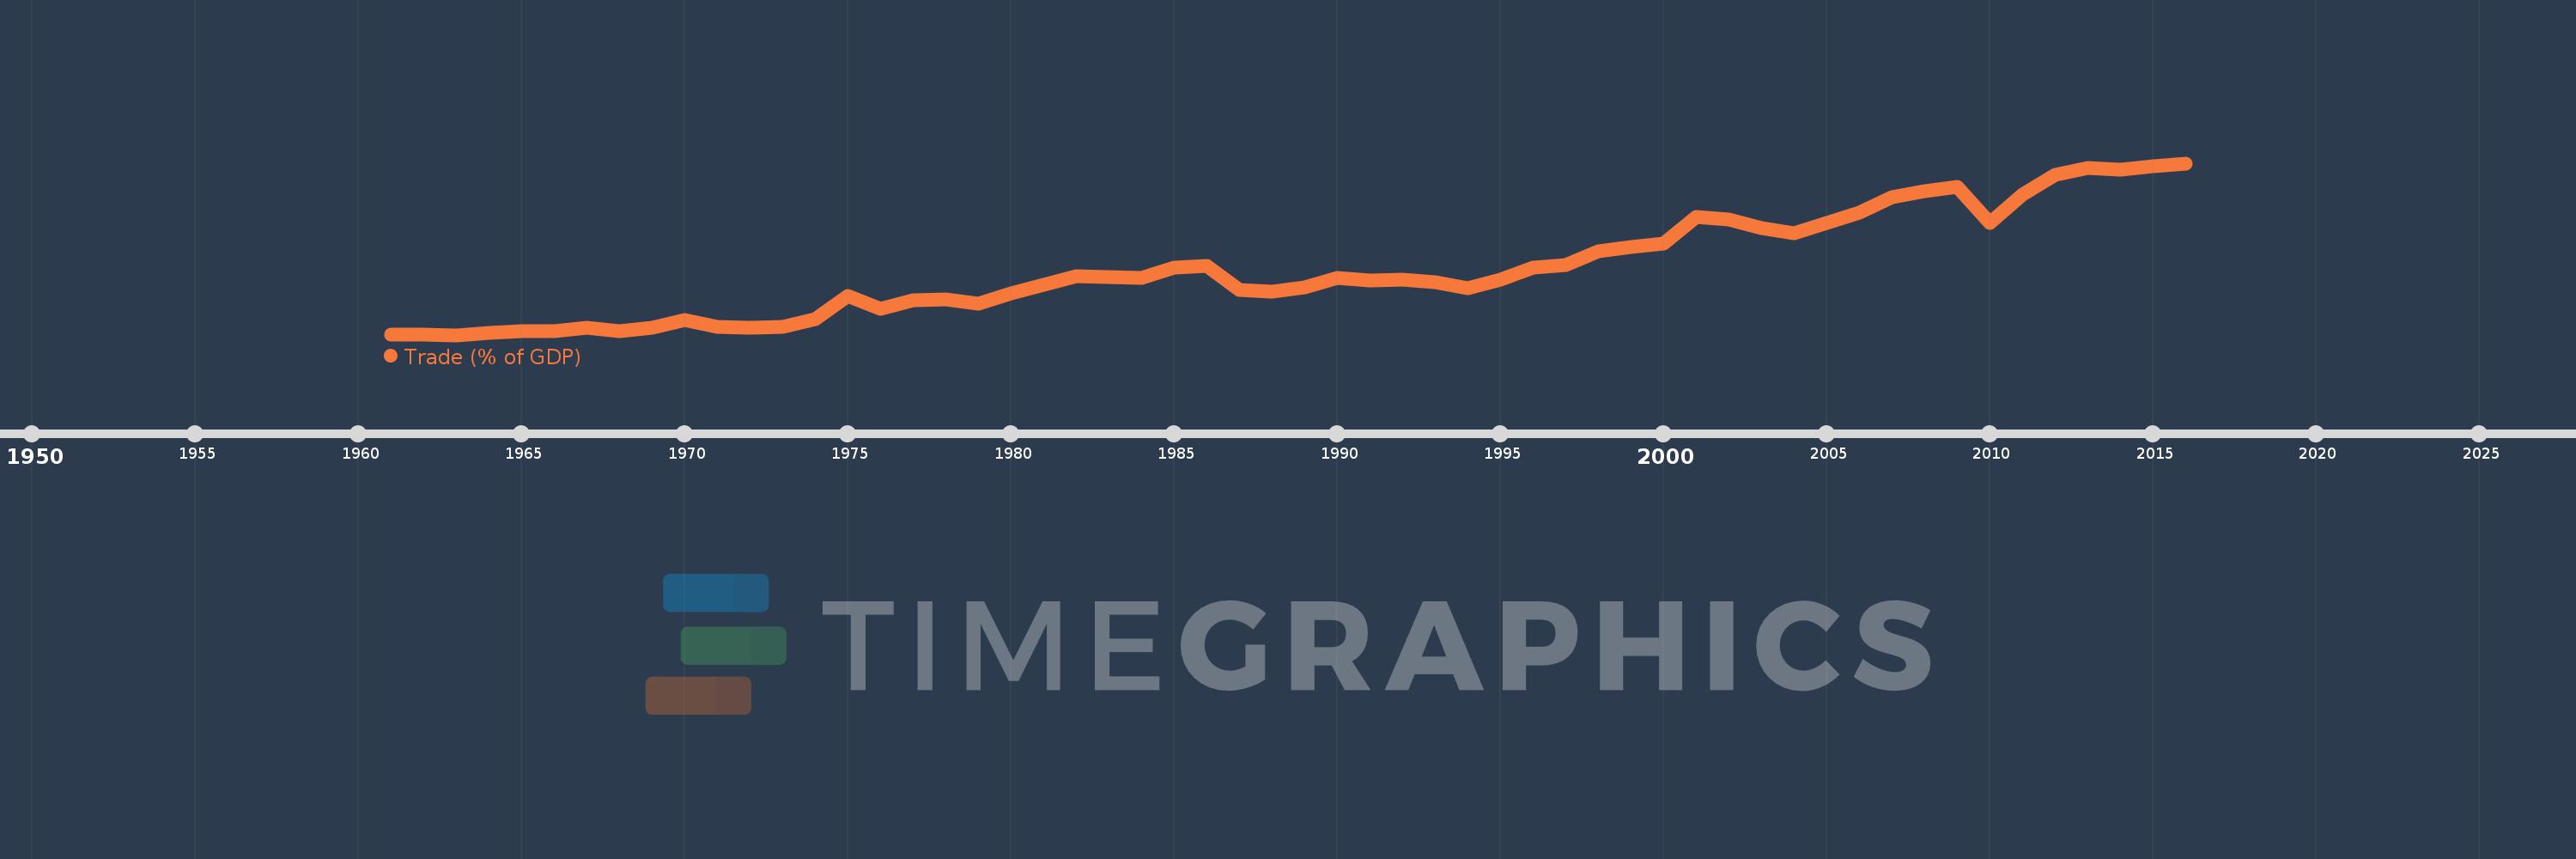
Euro area
EMU
false
2
1
Trade (% of GDP)
2016,2015,2014,2013,2012,2011,2010,2009,2008,2007,2006,2005,2004,2003,2002,2001,2000,1999,1998,1997,1996,1995,1994,1993,1992,1991,1990,1989,1988,1987,1986,1985,1984,1983,1982,1981,1980,1979,1978,1977,1976,1975,1974,1973,1972,1971,1970,1969,1968,1967,1966,1965,1964,1963,1962,1961
Estas estadísticas en otros países:
AfghanistanAlbaniaAlgeriaAngolaAntigua and BarbudaArab WorldArgentinaArmeniaArubaAustraliaAustriaAzerbaijanBahamas, TheBahrainBangladeshBarbadosBelarusBelgiumBelizeBeninBermudaBhutanBoliviaBosnia and HerzegovinaBotswanaBrazilBrunei DarussalamBulgariaBurkina FasoBurundiCabo VerdeCambodiaCameroonCanadaCaribbean small statesCentral African RepublicCentral Europe and the BalticsChadChileChinaColombiaComorosCongo, Dem. Rep.Congo, Rep.Costa RicaCote d'IvoireCroatiaCubaCyprusCzech RepublicDenmarkDjiboutiDominicaDominican RepublicEarly-demographic dividendEast Asia & PacificEast Asia & Pacific (excluding high income)East Asia & Pacific (IDA & IBRD countries)EcuadorEgypt, Arab Rep.El SalvadorEquatorial GuineaEritreaEstoniaEthiopiaEuro areaEurope & Central AsiaEurope & Central Asia (excluding high income)Europe & Central Asia (IDA & IBRD countries)European UnionFaroe IslandsFijiFinlandFragile and conflict affected situationsFranceFrench PolynesiaGabonGambia, TheGeorgiaGermanyGhanaGreeceGrenadaGuatemalaGuineaGuinea-BissauGuyanaHaitiHeavily indebted poor countries (HIPC)High incomeHondurasHong Kong SAR, ChinaHungaryIBRD onlyIcelandIDA & IBRD totalIDA blendIDA onlyIDA totalIndiaIndonesiaIran, Islamic Rep.IraqIrelandIsraelItalyJamaicaJapanJordanKazakhstanKenyaKiribatiKorea, Rep.KosovoKuwaitKyrgyz RepublicLao PDRLate-demographic dividendLatin America & Caribbean Latin America & Caribbean (excluding high income)Latin America & the Caribbean (IDA & IBRD countries)LatviaLeast developed countries: UN classificationLebanonLesothoLiberiaLibyaLithuaniaLow & middle incomeLow incomeLower middle incomeLuxembourgMacao SAR, ChinaMacedonia, FYRMadagascarMalawiMalaysiaMaldivesMaliMaltaMauritaniaMauritiusMexicoMicronesia, Fed. Sts.Middle East & North AfricaMiddle East & North Africa (excluding high income)Middle East & North Africa (IDA & IBRD countries)Middle incomeMoldovaMongoliaMontenegroMoroccoMozambiqueMyanmarNamibiaNepalNetherlandsNew CaledoniaNew ZealandNicaraguaNigerNigeriaNorth AmericaNorwayOECD membersOmanOther small statesPacific island small statesPakistanPalauPanamaPapua New GuineaParaguayPeruPhilippinesPolandPortugalPost-demographic dividendPre-demographic dividendPuerto RicoQatarRomaniaRussian FederationRwandaSamoaSaudi ArabiaSenegalSerbiaSeychellesSierra LeoneSingaporeSlovak RepublicSloveniaSmall statesSolomon IslandsSomaliaSouth AfricaSouth AsiaSouth Asia (IDA & IBRD)South SudanSpainSri LankaSt. Kitts and NevisSt. LuciaSt. Vincent and the GrenadinesSub-Saharan Africa Sub-Saharan Africa (excluding high income)Sub-Saharan Africa (IDA & IBRD countries)SudanSurinameSwazilandSwedenSwitzerlandSyrian Arab RepublicTajikistanTanzaniaThailandTimor-LesteTogoTongaTrinidad and TobagoTunisiaTurkeyTurkmenistanUgandaUkraineUnited Arab EmiratesUnited KingdomUnited StatesUpper middle incomeUruguayUzbekistanVanuatuVenezuela, RBVietnamWest Bank and GazaWorldYemen, Rep.ZambiaZimbabwe línea de tiempo (timeline):
En esta escala de tiempo se presenta un gráfico de 1961 y 2016 de Euro area. Los datos de 1960 están ausentes. El número de observaciones reales por fecha: 56.
Fuente (nombre):
Indicadores del desarrollo mundial
Fuente (organización):
World Bank national accounts data, and OECD National Accounts data files.
Categorías:
Economy & Growth, Trade
Se ha actualizado:
23 abr 2017 año
Los indicadores de los cambios de valor en los últimos años
Mínimo:
36.557
1 ene 1963 año
Máximo:
85.017
1 ene 2016 año
A la fecha de observación
Valor
Cambio absoluto
El cambio con respecto al valor anterior
1 ene 1961 año
36.709
+36.709
0.0%
1 ene 1962 año
36.716
+0.007
0.02%
1 ene 1963 año
36.557
-0.158
-0.43%
1 ene 1964 año
37.131
+0.574
1.57%
1 ene 1965 año
37.629
+0.497
1.34%
1 ene 1966 año
37.711
+0.083
0.22%
1 ene 1967 año
38.515
+0.803
2.13%
1 ene 1968 año
37.56
-0.955
-2.48%
1 ene 1969 año
38.659
+1.098
2.92%
1 ene 1970 año
40.899
+2.241
5.8%
1 ene 1971 año
38.872
-2.027
-4.96%
1 ene 1972 año
38.629
-0.244
-0.63%
1 ene 1973 año
38.863
+0.234
0.61%
1 ene 1974 año
40.972
+2.11
5.43%
1 ene 1975 año
47.661
+6.688
16.32%
1 ene 1976 año
43.875
-3.786
-7.94%
1 ene 1977 año
46.454
+2.579
5.88%
1 ene 1978 año
46.581
+0.127
0.27%
1 ene 1979 año
45.403
-1.177
-2.53%
1 ene 1980 año
48.258
+2.854
6.29%
1 ene 1981 año
50.677
+2.42
5.01%
1 ene 1982 año
53.268
+2.591
5.11%
1 ene 1983 año
52.96
-0.308
-0.58%
1 ene 1984 año
52.671
-0.289
-0.55%
1 ene 1985 año
55.668
+2.997
5.69%
1 ene 1986 año
56.097
+0.428
0.77%
1 ene 1987 año
49.384
-6.712
-11.97%
1 ene 1988 año
48.832
-0.552
-1.12%
1 ene 1989 año
49.998
+1.165
2.39%
1 ene 1990 año
52.782
+2.784
5.57%
1 ene 1991 año
51.99
-0.792
-1.5%
1 ene 1992 año
52.139
+0.149
0.29%
1 ene 1993 año
51.355
-0.785
-1.51%
1 ene 1994 año
49.712
-1.643
-3.2%
1 ene 1995 año
52.287
+2.575
5.18%
1 ene 1996 año
55.619
+3.332
6.37%
1 ene 1997 año
56.217
+0.598
1.08%
1 ene 1998 año
60.172
+3.954
7.03%
1 ene 1999 año
61.438
+1.266
2.1%
1 ene 2000 año
62.284
+0.847
1.38%
1 ene 2001 año
69.937
+7.653
12.29%
1 ene 2002 año
69.144
-0.794
-1.13%
1 ene 2003 año
66.71
-2.434
-3.52%
1 ene 2004 año
65.243
-1.467
-2.2%
1 ene 2005 año
68.102
+2.859
4.38%
1 ene 2006 año
71.19
+3.087
4.53%
1 ene 2007 año
75.43
+4.24
5.96%
1 ene 2008 año
77.254
+1.824
2.42%
1 ene 2009 año
78.463
+1.208
1.56%
1 ene 2010 año
68.134
-10.329
-13.16%
1 ene 2011 año
76.268
+8.134
11.94%
1 ene 2012 año
81.73
+5.462
7.16%
1 ene 2013 año
83.604
+1.874
2.29%
1 ene 2014 año
83.22
-0.384
-0.46%
1 ene 2015 año
84.081
+0.861
1.03%
1 ene 2016 año
85.017
+0.936
1.11%
Ranking de los países por los datos estadísticos actuales


Comentarios: