29
/es/
es
AIzaSyAYiBZKx7MnpbEhh9jyipgxe19OcubqV5w
April 1, 2024
31200
Europe & Central Asia
ECS
false
2
1
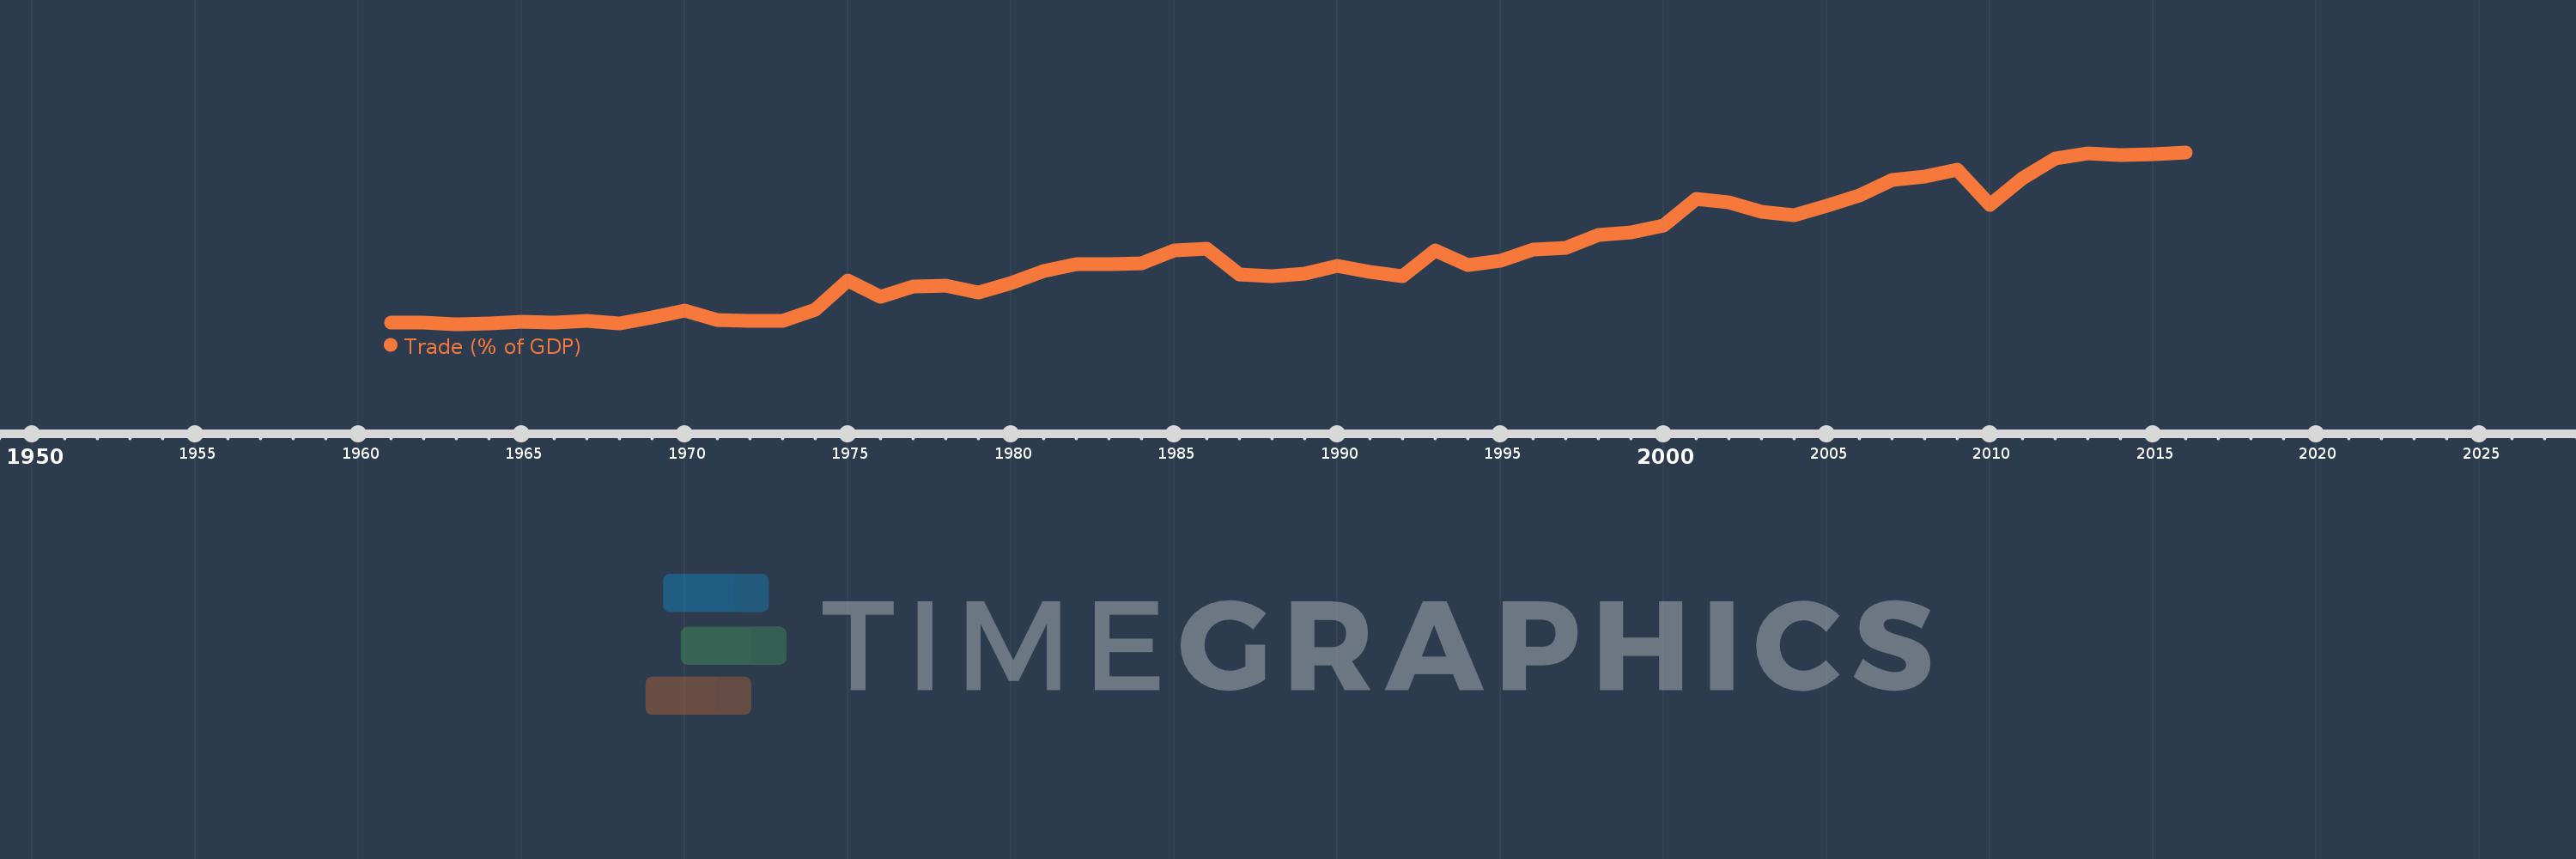
Trade (% of GDP)
2016,2015,2014,2013,2012,2011,2010,2009,2008,2007,2006,2005,2004,2003,2002,2001,2000,1999,1998,1997,1996,1995,1994,1993,1992,1991,1990,1989,1988,1987,1986,1985,1984,1983,1982,1981,1980,1979,1978,1977,1976,1975,1974,1973,1972,1971,1970,1969,1968,1967,1966,1965,1964,1963,1962,1961
Estas estadísticas en otros países:
AfghanistanAlbaniaAlgeriaAngolaAntigua and BarbudaArab WorldArgentinaArmeniaArubaAustraliaAustriaAzerbaijanBahamas, TheBahrainBangladeshBarbadosBelarusBelgiumBelizeBeninBermudaBhutanBoliviaBosnia and HerzegovinaBotswanaBrazilBrunei DarussalamBulgariaBurkina FasoBurundiCabo VerdeCambodiaCameroonCanadaCaribbean small statesCentral African RepublicCentral Europe and the BalticsChadChileChinaColombiaComorosCongo, Dem. Rep.Congo, Rep.Costa RicaCote d'IvoireCroatiaCubaCyprusCzech RepublicDenmarkDjiboutiDominicaDominican RepublicEarly-demographic dividendEast Asia & PacificEast Asia & Pacific (excluding high income)East Asia & Pacific (IDA & IBRD countries)EcuadorEgypt, Arab Rep.El SalvadorEquatorial GuineaEritreaEstoniaEthiopiaEuro areaEurope & Central AsiaEurope & Central Asia (excluding high income)Europe & Central Asia (IDA & IBRD countries)European UnionFaroe IslandsFijiFinlandFragile and conflict affected situationsFranceFrench PolynesiaGabonGambia, TheGeorgiaGermanyGhanaGreeceGrenadaGuatemalaGuineaGuinea-BissauGuyanaHaitiHeavily indebted poor countries (HIPC)High incomeHondurasHong Kong SAR, ChinaHungaryIBRD onlyIcelandIDA & IBRD totalIDA blendIDA onlyIDA totalIndiaIndonesiaIran, Islamic Rep.IraqIrelandIsraelItalyJamaicaJapanJordanKazakhstanKenyaKiribatiKorea, Rep.KosovoKuwaitKyrgyz RepublicLao PDRLate-demographic dividendLatin America & Caribbean Latin America & Caribbean (excluding high income)Latin America & the Caribbean (IDA & IBRD countries)LatviaLeast developed countries: UN classificationLebanonLesothoLiberiaLibyaLithuaniaLow & middle incomeLow incomeLower middle incomeLuxembourgMacao SAR, ChinaMacedonia, FYRMadagascarMalawiMalaysiaMaldivesMaliMaltaMauritaniaMauritiusMexicoMicronesia, Fed. Sts.Middle East & North AfricaMiddle East & North Africa (excluding high income)Middle East & North Africa (IDA & IBRD countries)Middle incomeMoldovaMongoliaMontenegroMoroccoMozambiqueMyanmarNamibiaNepalNetherlandsNew CaledoniaNew ZealandNicaraguaNigerNigeriaNorth AmericaNorwayOECD membersOmanOther small statesPacific island small statesPakistanPalauPanamaPapua New GuineaParaguayPeruPhilippinesPolandPortugalPost-demographic dividendPre-demographic dividendPuerto RicoQatarRomaniaRussian FederationRwandaSamoaSaudi ArabiaSenegalSerbiaSeychellesSierra LeoneSingaporeSlovak RepublicSloveniaSmall statesSolomon IslandsSomaliaSouth AfricaSouth AsiaSouth Asia (IDA & IBRD)South SudanSpainSri LankaSt. Kitts and NevisSt. LuciaSt. Vincent and the GrenadinesSub-Saharan Africa Sub-Saharan Africa (excluding high income)Sub-Saharan Africa (IDA & IBRD countries)SudanSurinameSwazilandSwedenSwitzerlandSyrian Arab RepublicTajikistanTanzaniaThailandTimor-LesteTogoTongaTrinidad and TobagoTunisiaTurkeyTurkmenistanUgandaUkraineUnited Arab EmiratesUnited KingdomUnited StatesUpper middle incomeUruguayUzbekistanVanuatuVenezuela, RBVietnamWest Bank and GazaWorldYemen, Rep.ZambiaZimbabwe línea de tiempo (timeline):
En esta escala de tiempo se presenta un gráfico de 1961 y 2016 de Europe & Central Asia. Los datos de 1960 están ausentes. El número de observaciones reales por fecha: 56.
Fuente (nombre):
Indicadores del desarrollo mundial
Fuente (organización):
World Bank national accounts data, and OECD National Accounts data files.
Categorías:
Economy & Growth, Trade
Se ha actualizado:
23 abr 2017 año
Los indicadores de los cambios de valor en los últimos años
Mínimo:
38.46
1 ene 1963 año
Máximo:
80.813
1 ene 2016 año
A la fecha de observación
Valor
Cambio absoluto
El cambio con respecto al valor anterior
1 ene 1961 año
38.965
+38.965
0.0%
1 ene 1962 año
38.806
-0.159
-0.41%
1 ene 1963 año
38.46
-0.346
-0.89%
1 ene 1964 año
38.717
+0.256
0.67%
1 ene 1965 año
39.085
+0.368
0.95%
1 ene 1966 año
38.874
-0.211
-0.54%
1 ene 1967 año
39.303
+0.429
1.1%
1 ene 1968 año
38.648
-0.655
-1.67%
1 ene 1969 año
40.173
+1.525
3.95%
1 ene 1970 año
41.895
+1.722
4.29%
1 ene 1971 año
39.532
-2.363
-5.64%
1 ene 1972 año
39.315
-0.217
-0.55%
1 ene 1973 año
39.24
-0.075
-0.19%
1 ene 1974 año
42.052
+2.811
7.16%
1 ene 1975 año
49.272
+7.22
17.17%
1 ene 1976 año
45.138
-4.134
-8.39%
1 ene 1977 año
47.786
+2.648
5.87%
1 ene 1978 año
47.952
+0.165
0.35%
1 ene 1979 año
46.17
-1.781
-3.71%
1 ene 1980 año
48.505
+2.335
5.06%
1 ene 1981 año
51.52
+3.015
6.21%
1 ene 1982 año
53.343
+1.823
3.54%
1 ene 1983 año
53.314
-0.029
-0.05%
1 ene 1984 año
53.426
+0.112
0.21%
1 ene 1985 año
56.63
+3.204
6.0%
1 ene 1986 año
56.999
+0.37
0.65%
1 ene 1987 año
50.761
-6.239
-10.94%
1 ene 1988 año
50.234
-0.526
-1.04%
1 ene 1989 año
50.974
+0.74
1.47%
1 ene 1990 año
52.745
+1.771
3.47%
1 ene 1991 año
51.418
-1.328
-2.52%
1 ene 1992 año
50.276
-1.141
-2.22%
1 ene 1993 año
56.587
+6.311
12.55%
1 ene 1994 año
52.958
-3.63
-6.41%
1 ene 1995 año
54.104
+1.146
2.16%
1 ene 1996 año
56.954
+2.849
5.27%
1 ene 1997 año
57.29
+0.336
0.59%
1 ene 1998 año
60.43
+3.14
5.48%
1 ene 1999 año
61.156
+0.726
1.2%
1 ene 2000 año
62.796
+1.64
2.68%
1 ene 2001 año
69.4
+6.604
10.52%
1 ene 2002 año
68.484
-0.917
-1.32%
1 ene 2003 año
66.235
-2.248
-3.28%
1 ene 2004 año
65.308
-0.928
-1.4%
1 ene 2005 año
67.717
+2.409
3.69%
1 ene 2006 año
70.185
+2.468
3.64%
1 ene 2007 año
73.918
+3.734
5.32%
1 ene 2008 año
74.807
+0.889
1.2%
1 ene 2009 año
76.519
+1.712
2.29%
1 ene 2010 año
67.779
-8.74
-11.42%
1 ene 2011 año
74.512
+6.732
9.93%
1 ene 2012 año
79.374
+4.862
6.53%
1 ene 2013 año
80.497
+1.123
1.42%
1 ene 2014 año
80.233
-0.264
-0.33%
1 ene 2015 año
80.345
+0.112
0.14%
1 ene 2016 año
80.813
+0.468
0.58%
Ranking de los países por los datos estadísticos actuales


Comentarios: