29
/es/
es
AIzaSyAYiBZKx7MnpbEhh9jyipgxe19OcubqV5w
April 1, 2024
55948
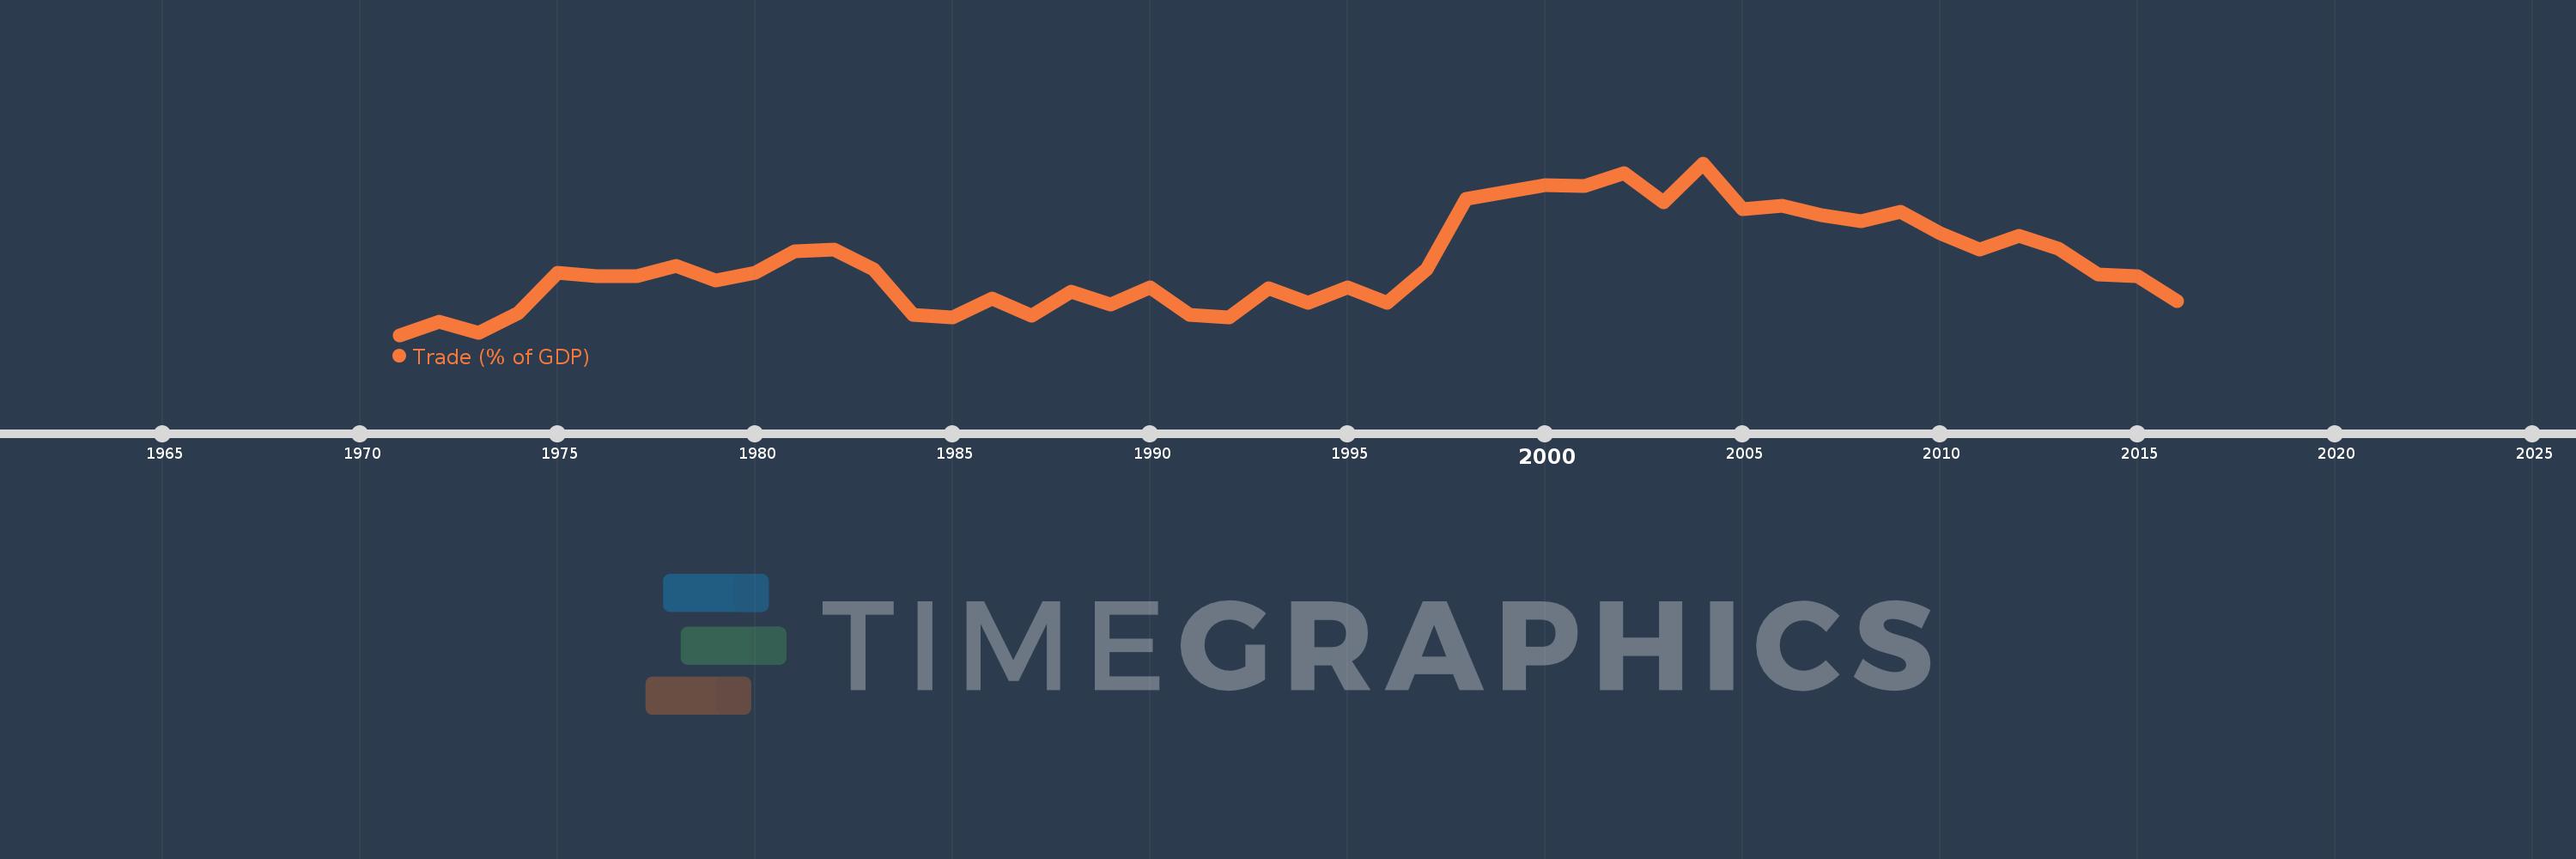
Pre-demographic dividend
PRE
false
2
1
Trade (% of GDP)
2016,2015,2014,2013,2012,2011,2010,2009,2008,2007,2006,2005,2004,2003,2002,2001,2000,1999,1998,1997,1996,1995,1994,1993,1992,1991,1990,1989,1988,1987,1986,1985,1984,1983,1982,1981,1980,1979,1978,1977,1976,1975,1974,1973,1972,1971
Estas estadísticas en otros países:
AfghanistanAlbaniaAlgeriaAngolaAntigua and BarbudaArab WorldArgentinaArmeniaArubaAustraliaAustriaAzerbaijanBahamas, TheBahrainBangladeshBarbadosBelarusBelgiumBelizeBeninBermudaBhutanBoliviaBosnia and HerzegovinaBotswanaBrazilBrunei DarussalamBulgariaBurkina FasoBurundiCabo VerdeCambodiaCameroonCanadaCaribbean small statesCentral African RepublicCentral Europe and the BalticsChadChileChinaColombiaComorosCongo, Dem. Rep.Congo, Rep.Costa RicaCote d'IvoireCroatiaCubaCyprusCzech RepublicDenmarkDjiboutiDominicaDominican RepublicEarly-demographic dividendEast Asia & PacificEast Asia & Pacific (excluding high income)East Asia & Pacific (IDA & IBRD countries)EcuadorEgypt, Arab Rep.El SalvadorEquatorial GuineaEritreaEstoniaEthiopiaEuro areaEurope & Central AsiaEurope & Central Asia (excluding high income)Europe & Central Asia (IDA & IBRD countries)European UnionFaroe IslandsFijiFinlandFragile and conflict affected situationsFranceFrench PolynesiaGabonGambia, TheGeorgiaGermanyGhanaGreeceGrenadaGuatemalaGuineaGuinea-BissauGuyanaHaitiHeavily indebted poor countries (HIPC)High incomeHondurasHong Kong SAR, ChinaHungaryIBRD onlyIcelandIDA & IBRD totalIDA blendIDA onlyIDA totalIndiaIndonesiaIran, Islamic Rep.IraqIrelandIsraelItalyJamaicaJapanJordanKazakhstanKenyaKiribatiKorea, Rep.KosovoKuwaitKyrgyz RepublicLao PDRLate-demographic dividendLatin America & Caribbean Latin America & Caribbean (excluding high income)Latin America & the Caribbean (IDA & IBRD countries)LatviaLeast developed countries: UN classificationLebanonLesothoLiberiaLibyaLithuaniaLow & middle incomeLow incomeLower middle incomeLuxembourgMacao SAR, ChinaMacedonia, FYRMadagascarMalawiMalaysiaMaldivesMaliMaltaMauritaniaMauritiusMexicoMicronesia, Fed. Sts.Middle East & North AfricaMiddle East & North Africa (excluding high income)Middle East & North Africa (IDA & IBRD countries)Middle incomeMoldovaMongoliaMontenegroMoroccoMozambiqueMyanmarNamibiaNepalNetherlandsNew CaledoniaNew ZealandNicaraguaNigerNigeriaNorth AmericaNorwayOECD membersOmanOther small statesPacific island small statesPakistanPalauPanamaPapua New GuineaParaguayPeruPhilippinesPolandPortugalPost-demographic dividendPre-demographic dividendPuerto RicoQatarRomaniaRussian FederationRwandaSamoaSaudi ArabiaSenegalSerbiaSeychellesSierra LeoneSingaporeSlovak RepublicSloveniaSmall statesSolomon IslandsSomaliaSouth AfricaSouth AsiaSouth Asia (IDA & IBRD)South SudanSpainSri LankaSt. Kitts and NevisSt. LuciaSt. Vincent and the GrenadinesSub-Saharan Africa Sub-Saharan Africa (excluding high income)Sub-Saharan Africa (IDA & IBRD countries)SudanSurinameSwazilandSwedenSwitzerlandSyrian Arab RepublicTajikistanTanzaniaThailandTimor-LesteTogoTongaTrinidad and TobagoTunisiaTurkeyTurkmenistanUgandaUkraineUnited Arab EmiratesUnited KingdomUnited StatesUpper middle incomeUruguayUzbekistanVanuatuVenezuela, RBVietnamWest Bank and GazaWorldYemen, Rep.ZambiaZimbabwe línea de tiempo (timeline):
En esta escala de tiempo se presenta un gráfico de 1971 y 2016 de Pre-demographic dividend. Los datos de 1970 están ausentes. El número de observaciones reales por fecha: 46.
Fuente (nombre):
Indicadores del desarrollo mundial
Fuente (organización):
World Bank national accounts data, and OECD National Accounts data files.
Categorías:
Economy & Growth, Trade
Se ha actualizado:
23 abr 2017 año
Los indicadores de los cambios de valor en los últimos años
Mínimo:
39.518
1 ene 1971 año
Máximo:
87.815
1 ene 2004 año
A la fecha de observación
Valor
Cambio absoluto
El cambio con respecto al valor anterior
1 ene 1971 año
39.518
+39.518
0.0%
1 ene 1972 año
43.173
+3.655
9.25%
1 ene 1973 año
40.072
-3.101
-7.18%
1 ene 1974 año
45.778
+5.706
14.24%
1 ene 1975 año
57.097
+11.32
24.73%
1 ene 1976 año
55.96
-1.138
-1.99%
1 ene 1977 año
56.154
+0.195
0.35%
1 ene 1978 año
58.903
+2.749
4.9%
1 ene 1979 año
54.924
-3.979
-6.76%
1 ene 1980 año
56.998
+2.074
3.78%
1 ene 1981 año
63.11
+6.112
10.72%
1 ene 1982 año
63.468
+0.357
0.57%
1 ene 1983 año
57.893
-5.574
-8.78%
1 ene 1984 año
45.127
-12.766
-22.05%
1 ene 1985 año
44.443
-0.684
-1.52%
1 ene 1986 año
49.687
+5.244
11.8%
1 ene 1987 año
44.972
-4.715
-9.49%
1 ene 1988 año
51.721
+6.749
15.01%
1 ene 1989 año
47.98
-3.741
-7.23%
1 ene 1990 año
52.819
+4.839
10.09%
1 ene 1991 año
45.264
-7.555
-14.3%
1 ene 1992 año
44.571
-0.693
-1.53%
1 ene 1993 año
52.782
+8.211
18.42%
1 ene 1994 año
48.475
-4.306
-8.16%
1 ene 1995 año
52.924
+4.449
9.18%
1 ene 1996 año
48.515
-4.409
-8.33%
1 ene 1997 año
58.047
+9.532
19.65%
1 ene 1998 año
77.857
+19.81
34.13%
1 ene 1999 año
79.705
+1.848
2.37%
1 ene 2000 año
81.55
+1.845
2.31%
1 ene 2001 año
81.425
-0.125
-0.15%
1 ene 2002 año
84.95
+3.525
4.33%
1 ene 2003 año
76.881
-8.069
-9.5%
1 ene 2004 año
87.815
+10.934
14.22%
1 ene 2005 año
74.846
-12.97
-14.77%
1 ene 2006 año
75.911
+1.066
1.42%
1 ene 2007 año
73.235
-2.677
-3.53%
1 ene 2008 año
71.424
-1.811
-2.47%
1 ene 2009 año
74.276
+2.853
3.99%
1 ene 2010 año
68.02
-6.257
-8.42%
1 ene 2011 año
63.558
-4.462
-6.56%
1 ene 2012 año
67.485
+3.927
6.18%
1 ene 2013 año
63.831
-3.654
-5.41%
1 ene 2014 año
56.436
-7.395
-11.58%
1 ene 2015 año
56.138
-0.298
-0.53%
1 ene 2016 año
49.057
-7.081
-12.61%
Ranking de los países por los datos estadísticos actuales


Comentarios: