29
/es/
es
AIzaSyAYiBZKx7MnpbEhh9jyipgxe19OcubqV5w
April 1, 2024
214889
Norway
NOR
true
2
1
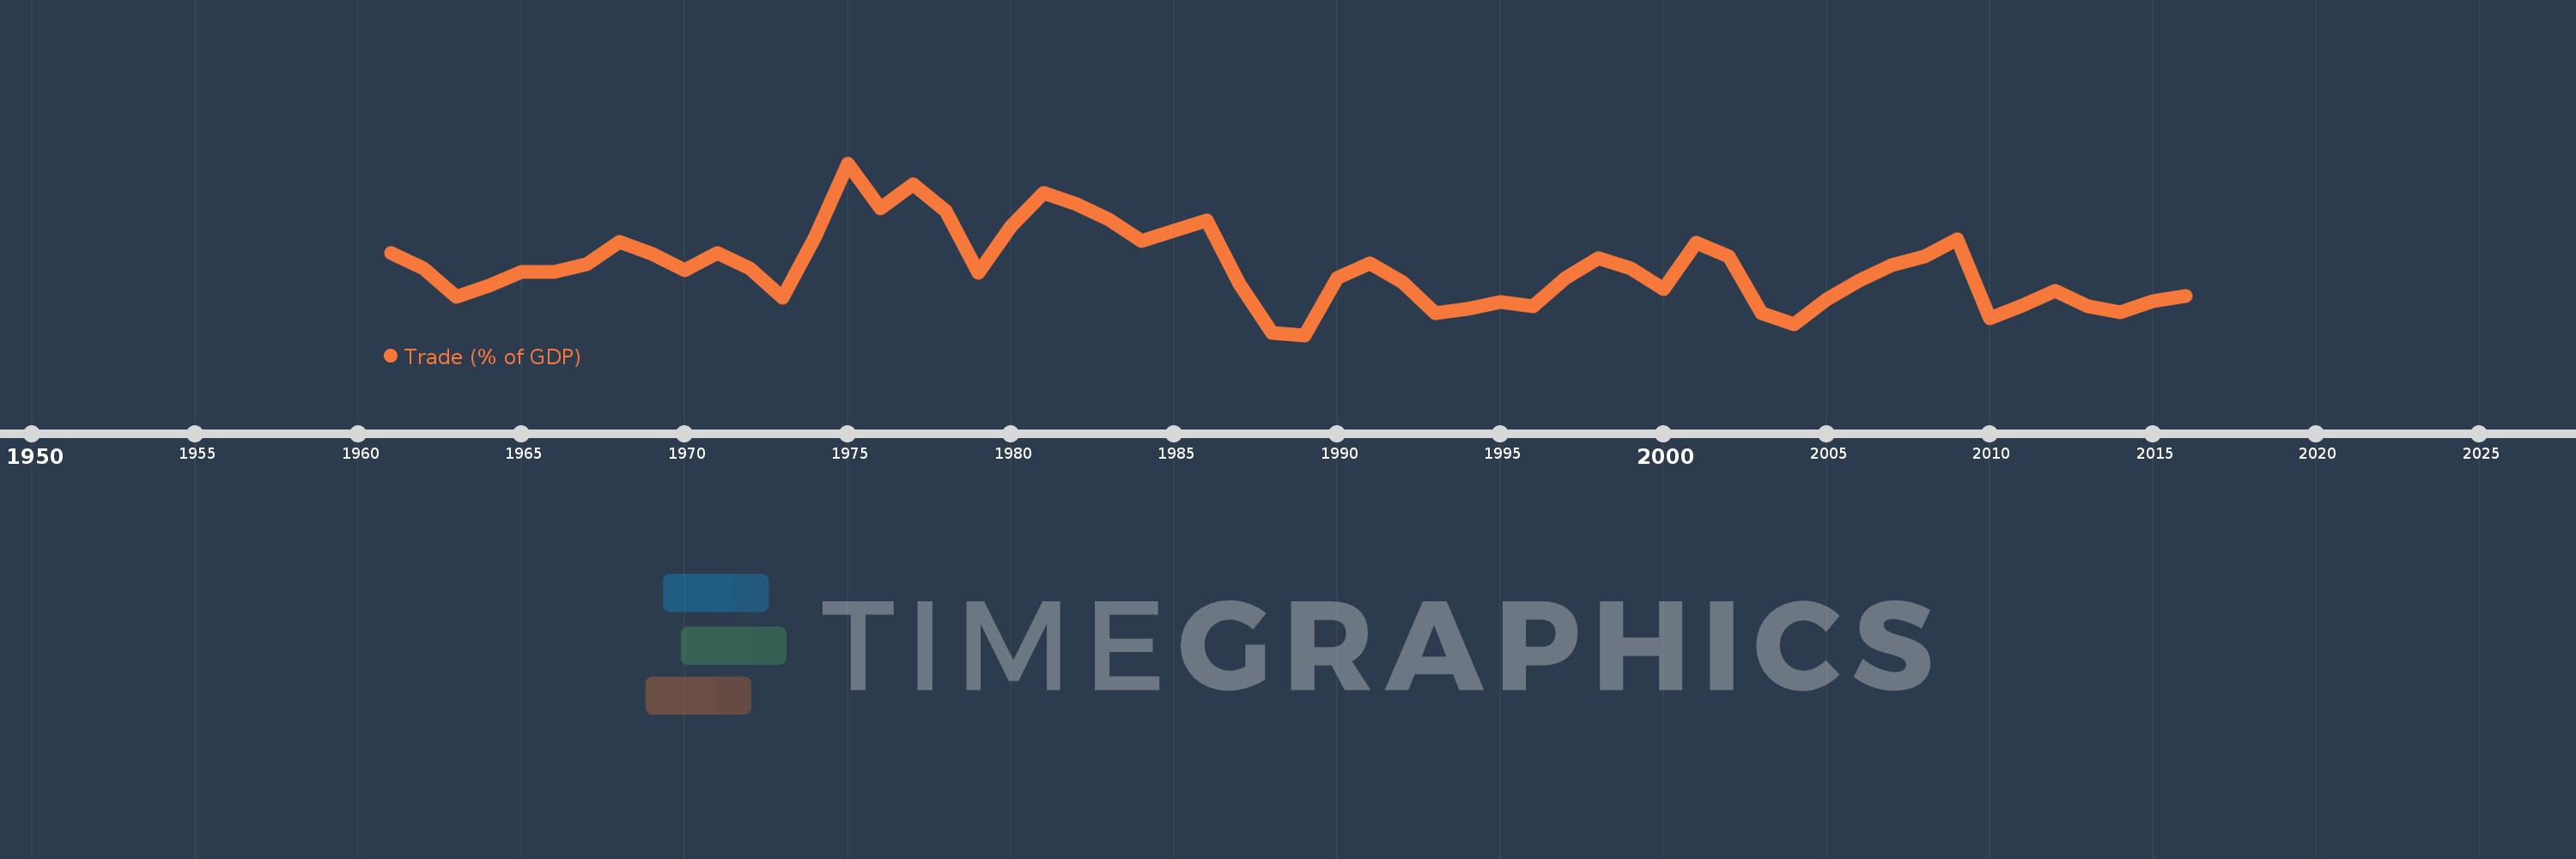
Trade (% of GDP)
2016,2015,2014,2013,2012,2011,2010,2009,2008,2007,2006,2005,2004,2003,2002,2001,2000,1999,1998,1997,1996,1995,1994,1993,1992,1991,1990,1989,1988,1987,1986,1985,1984,1983,1982,1981,1980,1979,1978,1977,1976,1975,1974,1973,1972,1971,1970,1969,1968,1967,1966,1965,1964,1963,1962,1961
Estas estadísticas en otros países:
AfghanistanAlbaniaAlgeriaAngolaAntigua and BarbudaArab WorldArgentinaArmeniaArubaAustraliaAustriaAzerbaijanBahamas, TheBahrainBangladeshBarbadosBelarusBelgiumBelizeBeninBermudaBhutanBoliviaBosnia and HerzegovinaBotswanaBrazilBrunei DarussalamBulgariaBurkina FasoBurundiCabo VerdeCambodiaCameroonCanadaCaribbean small statesCentral African RepublicCentral Europe and the BalticsChadChileChinaColombiaComorosCongo, Dem. Rep.Congo, Rep.Costa RicaCote d'IvoireCroatiaCubaCyprusCzech RepublicDenmarkDjiboutiDominicaDominican RepublicEarly-demographic dividendEast Asia & PacificEast Asia & Pacific (excluding high income)East Asia & Pacific (IDA & IBRD countries)EcuadorEgypt, Arab Rep.El SalvadorEquatorial GuineaEritreaEstoniaEthiopiaEuro areaEurope & Central AsiaEurope & Central Asia (excluding high income)Europe & Central Asia (IDA & IBRD countries)European UnionFaroe IslandsFijiFinlandFragile and conflict affected situationsFranceFrench PolynesiaGabonGambia, TheGeorgiaGermanyGhanaGreeceGrenadaGuatemalaGuineaGuinea-BissauGuyanaHaitiHeavily indebted poor countries (HIPC)High incomeHondurasHong Kong SAR, ChinaHungaryIBRD onlyIcelandIDA & IBRD totalIDA blendIDA onlyIDA totalIndiaIndonesiaIran, Islamic Rep.IraqIrelandIsraelItalyJamaicaJapanJordanKazakhstanKenyaKiribatiKorea, Rep.KosovoKuwaitKyrgyz RepublicLao PDRLate-demographic dividendLatin America & Caribbean Latin America & Caribbean (excluding high income)Latin America & the Caribbean (IDA & IBRD countries)LatviaLeast developed countries: UN classificationLebanonLesothoLiberiaLibyaLithuaniaLow & middle incomeLow incomeLower middle incomeLuxembourgMacao SAR, ChinaMacedonia, FYRMadagascarMalawiMalaysiaMaldivesMaliMaltaMauritaniaMauritiusMexicoMicronesia, Fed. Sts.Middle East & North AfricaMiddle East & North Africa (excluding high income)Middle East & North Africa (IDA & IBRD countries)Middle incomeMoldovaMongoliaMontenegroMoroccoMozambiqueMyanmarNamibiaNepalNetherlandsNew CaledoniaNew ZealandNicaraguaNigerNigeriaNorth AmericaNorwayOECD membersOmanOther small statesPacific island small statesPakistanPalauPanamaPapua New GuineaParaguayPeruPhilippinesPolandPortugalPost-demographic dividendPre-demographic dividendPuerto RicoQatarRomaniaRussian FederationRwandaSamoaSaudi ArabiaSenegalSerbiaSeychellesSierra LeoneSingaporeSlovak RepublicSloveniaSmall statesSolomon IslandsSomaliaSouth AfricaSouth AsiaSouth Asia (IDA & IBRD)South SudanSpainSri LankaSt. Kitts and NevisSt. LuciaSt. Vincent and the GrenadinesSub-Saharan Africa Sub-Saharan Africa (excluding high income)Sub-Saharan Africa (IDA & IBRD countries)SudanSurinameSwazilandSwedenSwitzerlandSyrian Arab RepublicTajikistanTanzaniaThailandTimor-LesteTogoTongaTrinidad and TobagoTunisiaTurkeyTurkmenistanUgandaUkraineUnited Arab EmiratesUnited KingdomUnited StatesUpper middle incomeUruguayUzbekistanVanuatuVenezuela, RBVietnamWest Bank and GazaWorldYemen, Rep.ZambiaZimbabwe línea de tiempo (timeline):
En esta escala de tiempo se presenta un gráfico de 1961 y 2016 de Norway. Los datos de 1960 están ausentes. El número de observaciones reales por fecha: 56.
Fuente (nombre):
Indicadores del desarrollo mundial
Fuente (organización):
World Bank national accounts data, and OECD National Accounts data files.
Categorías:
Economy & Growth, Trade
Se ha actualizado:
23 abr 2017 año
Los indicadores de los cambios de valor en los últimos años
Mínimo:
65.508
1 ene 1989 año
Máximo:
82.396
1 ene 1975 año
A la fecha de observación
Valor
Cambio absoluto
El cambio con respecto al valor anterior
1 ene 1961 año
73.606
+73.606
0.0%
1 ene 1962 año
72.083
-1.523
-2.07%
1 ene 1963 año
69.284
-2.799
-3.88%
1 ene 1964 año
70.377
+1.092
1.58%
1 ene 1965 año
71.689
+1.313
1.87%
1 ene 1966 año
71.738
+0.048
0.07%
1 ene 1967 año
72.461
+0.723
1.01%
1 ene 1968 año
74.701
+2.24
3.09%
1 ene 1969 año
73.476
-1.225
-1.64%
1 ene 1970 año
71.913
-1.563
-2.13%
1 ene 1971 año
73.576
+1.663
2.31%
1 ene 1972 año
72.086
-1.49
-2.03%
1 ene 1973 año
69.146
-2.939
-4.08%
1 ene 1974 año
75.199
+6.053
8.75%
1 ene 1975 año
82.396
+7.197
9.57%
1 ene 1976 año
77.987
-4.409
-5.35%
1 ene 1977 año
80.299
+2.312
2.96%
1 ene 1978 año
77.672
-2.627
-3.27%
1 ene 1979 año
71.604
-6.068
-7.81%
1 ene 1980 año
76.177
+4.572
6.39%
1 ene 1981 año
79.484
+3.307
4.34%
1 ene 1982 año
78.36
-1.124
-1.41%
1 ene 1983 año
76.854
-1.506
-1.92%
1 ene 1984 año
74.749
-2.105
-2.74%
1 ene 1985 año
75.776
+1.028
1.37%
1 ene 1986 año
76.741
+0.965
1.27%
1 ene 1987 año
70.559
-6.182
-8.06%
1 ene 1988 año
65.734
-4.825
-6.84%
1 ene 1989 año
65.508
-0.226
-0.34%
1 ene 1990 año
71.164
+5.656
8.63%
1 ene 1991 año
72.59
+1.426
2.0%
1 ene 1992 año
70.676
-1.914
-2.64%
1 ene 1993 año
67.668
-3.008
-4.26%
1 ene 1994 año
68.049
+0.381
0.56%
1 ene 1995 año
68.728
+0.679
1.0%
1 ene 1996 año
68.327
-0.402
-0.58%
1 ene 1997 año
71.122
+2.795
4.09%
1 ene 1998 año
73.064
+1.942
2.73%
1 ene 1999 año
72.022
-1.042
-1.43%
1 ene 2000 año
70.008
-2.014
-2.8%
1 ene 2001 año
74.622
+4.614
6.59%
1 ene 2002 año
73.266
-1.355
-1.82%
1 ene 2003 año
67.647
-5.619
-7.67%
1 ene 2004 año
66.584
-1.063
-1.57%
1 ene 2005 año
69.049
+2.465
3.7%
1 ene 2006 año
70.851
+1.802
2.61%
1 ene 2007 año
72.389
+1.538
2.17%
1 ene 2008 año
73.194
+0.805
1.11%
1 ene 2009 año
74.939
+1.745
2.38%
1 ene 2010 año
67.131
-7.807
-10.42%
1 ene 2011 año
68.41
+1.278
1.9%
1 ene 2012 año
69.832
+1.422
2.08%
1 ene 2013 año
68.305
-1.527
-2.19%
1 ene 2014 año
67.704
-0.601
-0.88%
1 ene 2015 año
68.818
+1.114
1.65%
1 ene 2016 año
69.346
+0.528
0.77%
Ranking de los países por los datos estadísticos actuales


Comentarios: