29
/es/
es
AIzaSyAYiBZKx7MnpbEhh9jyipgxe19OcubqV5w
April 1, 2024
244300
Solomon Islands
SLB
true
2
1
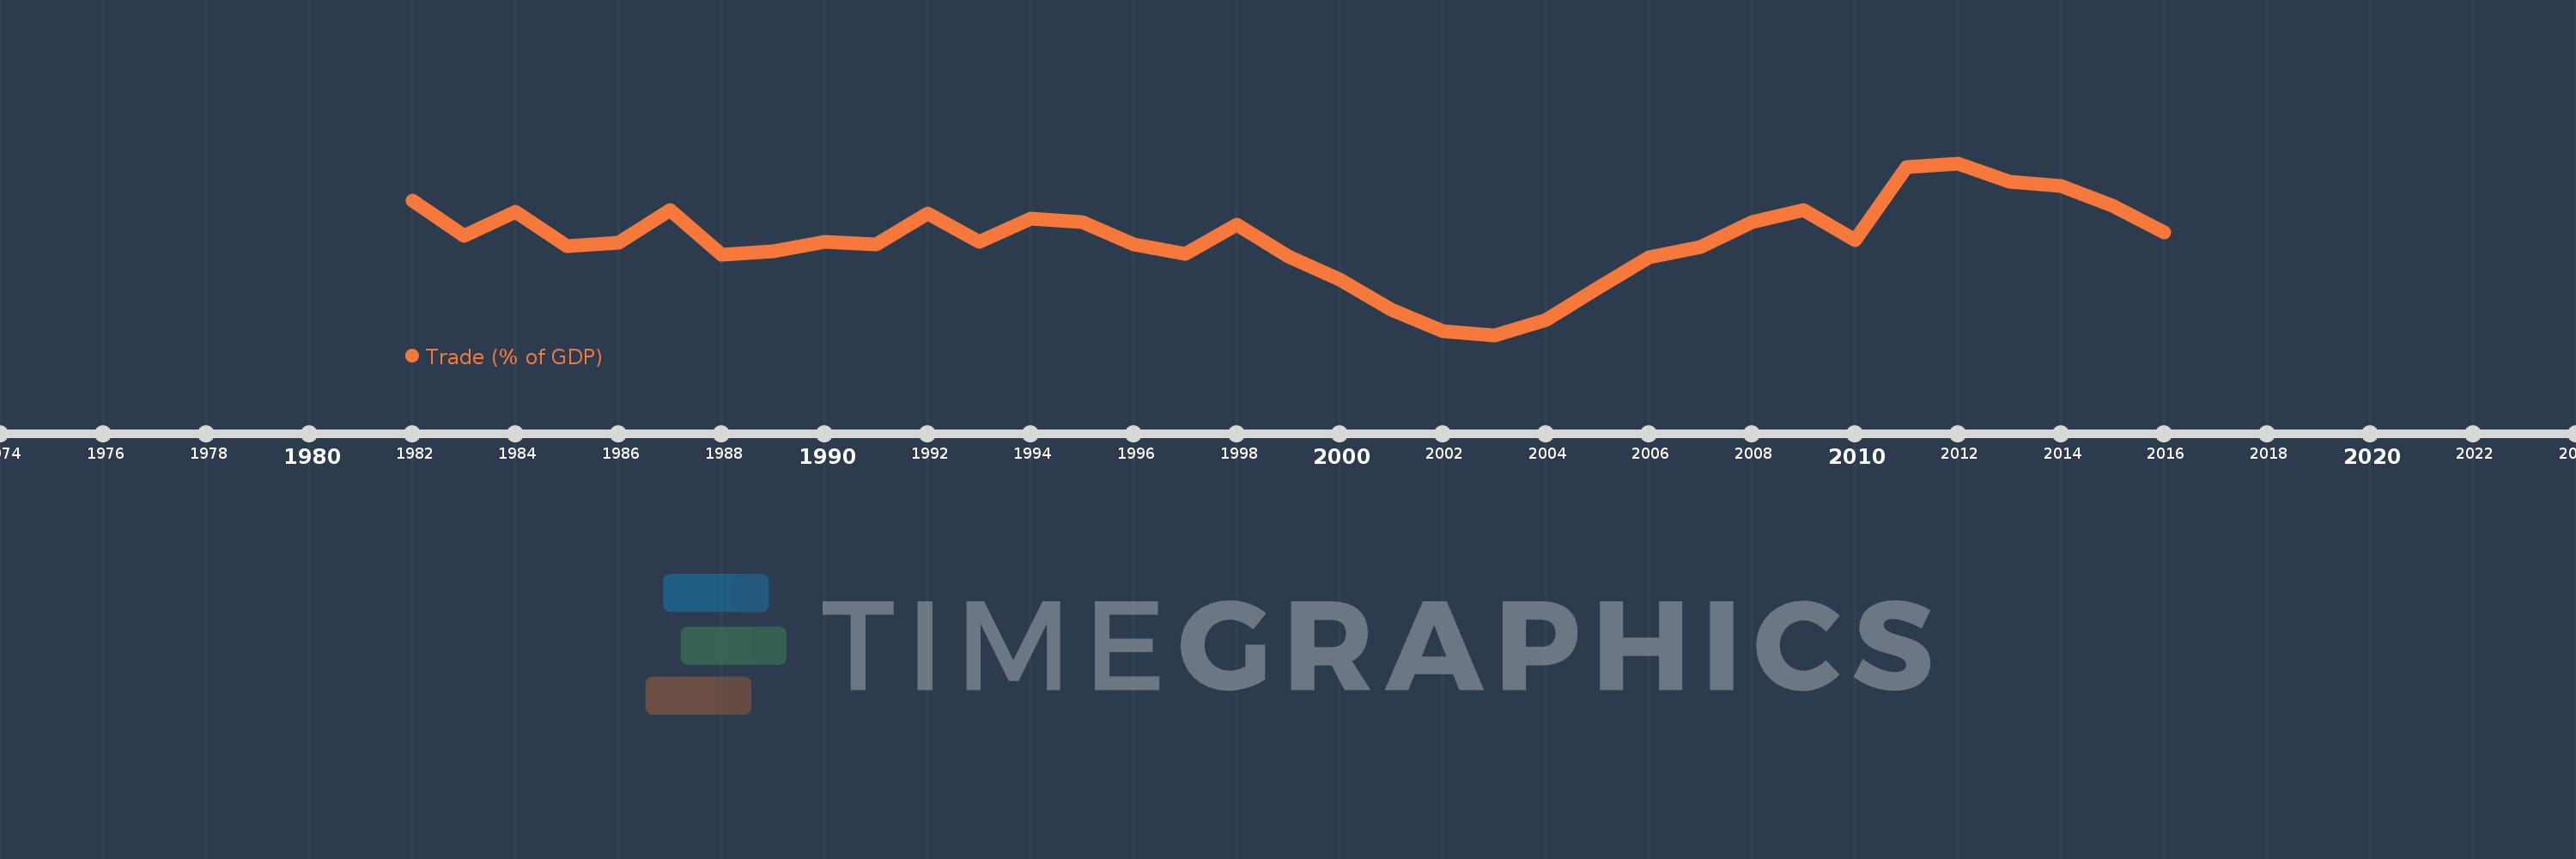
Trade (% of GDP)
2016,2015,2014,2013,2012,2011,2010,2009,2008,2007,2006,2005,2004,2003,2002,2001,2000,1999,1998,1997,1996,1995,1994,1993,1992,1991,1990,1989,1988,1987,1986,1985,1984,1983,1982
Estas estadísticas en otros países:
AfghanistanAlbaniaAlgeriaAngolaAntigua and BarbudaArab WorldArgentinaArmeniaArubaAustraliaAustriaAzerbaijanBahamas, TheBahrainBangladeshBarbadosBelarusBelgiumBelizeBeninBermudaBhutanBoliviaBosnia and HerzegovinaBotswanaBrazilBrunei DarussalamBulgariaBurkina FasoBurundiCabo VerdeCambodiaCameroonCanadaCaribbean small statesCentral African RepublicCentral Europe and the BalticsChadChileChinaColombiaComorosCongo, Dem. Rep.Congo, Rep.Costa RicaCote d'IvoireCroatiaCubaCyprusCzech RepublicDenmarkDjiboutiDominicaDominican RepublicEarly-demographic dividendEast Asia & PacificEast Asia & Pacific (excluding high income)East Asia & Pacific (IDA & IBRD countries)EcuadorEgypt, Arab Rep.El SalvadorEquatorial GuineaEritreaEstoniaEthiopiaEuro areaEurope & Central AsiaEurope & Central Asia (excluding high income)Europe & Central Asia (IDA & IBRD countries)European UnionFaroe IslandsFijiFinlandFragile and conflict affected situationsFranceFrench PolynesiaGabonGambia, TheGeorgiaGermanyGhanaGreeceGrenadaGuatemalaGuineaGuinea-BissauGuyanaHaitiHeavily indebted poor countries (HIPC)High incomeHondurasHong Kong SAR, ChinaHungaryIBRD onlyIcelandIDA & IBRD totalIDA blendIDA onlyIDA totalIndiaIndonesiaIran, Islamic Rep.IraqIrelandIsraelItalyJamaicaJapanJordanKazakhstanKenyaKiribatiKorea, Rep.KosovoKuwaitKyrgyz RepublicLao PDRLate-demographic dividendLatin America & Caribbean Latin America & Caribbean (excluding high income)Latin America & the Caribbean (IDA & IBRD countries)LatviaLeast developed countries: UN classificationLebanonLesothoLiberiaLibyaLithuaniaLow & middle incomeLow incomeLower middle incomeLuxembourgMacao SAR, ChinaMacedonia, FYRMadagascarMalawiMalaysiaMaldivesMaliMaltaMauritaniaMauritiusMexicoMicronesia, Fed. Sts.Middle East & North AfricaMiddle East & North Africa (excluding high income)Middle East & North Africa (IDA & IBRD countries)Middle incomeMoldovaMongoliaMontenegroMoroccoMozambiqueMyanmarNamibiaNepalNetherlandsNew CaledoniaNew ZealandNicaraguaNigerNigeriaNorth AmericaNorwayOECD membersOmanOther small statesPacific island small statesPakistanPalauPanamaPapua New GuineaParaguayPeruPhilippinesPolandPortugalPost-demographic dividendPre-demographic dividendPuerto RicoQatarRomaniaRussian FederationRwandaSamoaSaudi ArabiaSenegalSerbiaSeychellesSierra LeoneSingaporeSlovak RepublicSloveniaSmall statesSolomon IslandsSomaliaSouth AfricaSouth AsiaSouth Asia (IDA & IBRD)South SudanSpainSri LankaSt. Kitts and NevisSt. LuciaSt. Vincent and the GrenadinesSub-Saharan Africa Sub-Saharan Africa (excluding high income)Sub-Saharan Africa (IDA & IBRD countries)SudanSurinameSwazilandSwedenSwitzerlandSyrian Arab RepublicTajikistanTanzaniaThailandTimor-LesteTogoTongaTrinidad and TobagoTunisiaTurkeyTurkmenistanUgandaUkraineUnited Arab EmiratesUnited KingdomUnited StatesUpper middle incomeUruguayUzbekistanVanuatuVenezuela, RBVietnamWest Bank and GazaWorldYemen, Rep.ZambiaZimbabwe línea de tiempo (timeline):
En esta escala de tiempo se presenta un gráfico de 1982 y 2016 de Solomon Islands. Los datos de 1981 están ausentes. El número de observaciones reales por fecha: 35.
Fuente (nombre):
Indicadores del desarrollo mundial
Fuente (organización):
World Bank national accounts data, and OECD National Accounts data files.
Categorías:
Economy & Growth, Trade
Se ha actualizado:
23 abr 2017 año
Los indicadores de los cambios de valor en los últimos años
Mínimo:
50.546
1 ene 2003 año
Máximo:
134.425
1 ene 2012 año
A la fecha de observación
Valor
Cambio absoluto
El cambio con respecto al valor anterior
1 ene 1982 año
116.135
+116.135
0.0%
1 ene 1983 año
98.907
-17.228
-14.83%
1 ene 1984 año
110.676
+11.769
11.9%
1 ene 1985 año
94.161
-16.515
-14.92%
1 ene 1986 año
95.581
+1.42
1.51%
1 ene 1987 año
111.526
+15.944
16.68%
1 ene 1988 año
89.937
-21.589
-19.36%
1 ene 1989 año
91.499
+1.562
1.74%
1 ene 1990 año
96.234
+4.734
5.17%
1 ene 1991 año
94.745
-1.488
-1.55%
1 ene 1992 año
109.946
+15.201
16.04%
1 ene 1993 año
96.168
-13.778
-12.53%
1 ene 1994 año
107.466
+11.298
11.75%
1 ene 1995 año
105.524
-1.942
-1.81%
1 ene 1996 año
94.754
-10.77
-10.21%
1 ene 1997 año
90.231
-4.522
-4.77%
1 ene 1998 año
104.254
+14.023
15.54%
1 ene 1999 año
88.859
-15.396
-14.77%
1 ene 2000 año
77.793
-11.066
-12.45%
1 ene 2001 año
62.722
-15.07
-19.37%
1 ene 2002 año
52.402
-10.32
-16.45%
1 ene 2003 año
50.546
-1.856
-3.54%
1 ene 2004 año
58.082
+7.536
14.91%
1 ene 2005 año
73.297
+15.215
26.2%
1 ene 2006 año
88.677
+15.38
20.98%
1 ene 2007 año
93.373
+4.696
5.3%
1 ene 2008 año
105.674
+12.301
13.17%
1 ene 2009 año
111.5
+5.826
5.51%
1 ene 2010 año
96.9
-14.6
-13.09%
1 ene 2011 año
132.35
+35.45
36.58%
1 ene 2012 año
134.425
+2.075
1.57%
1 ene 2013 año
125.448
-8.977
-6.68%
1 ene 2014 año
123.262
-2.186
-1.74%
1 ene 2015 año
113.494
-9.768
-7.92%
1 ene 2016 año
100.615
-12.88
-11.35%
Ranking de los países por los datos estadísticos actuales


Comentarios: