29
/es/
es
AIzaSyAYiBZKx7MnpbEhh9jyipgxe19OcubqV5w
April 1, 2024
136255
Gabon
GAB
true
2
1
Trade (% of GDP)
2016,2015,2014,2013,2012,2011,2010,2009,2008,2007,2006,2005,2004,2003,2002,2001,2000,1999,1998,1997,1996,1995,1994,1993,1992,1991,1990,1989,1988,1987,1986,1985,1984,1983,1982,1981,1980,1979,1978,1977,1976,1975,1974,1973,1972,1971,1970,1969,1968,1967,1966,1965,1964,1963,1962,1961
Estas estadísticas en otros países:
AfghanistanAlbaniaAlgeriaAngolaAntigua and BarbudaArab WorldArgentinaArmeniaArubaAustraliaAustriaAzerbaijanBahamas, TheBahrainBangladeshBarbadosBelarusBelgiumBelizeBeninBermudaBhutanBoliviaBosnia and HerzegovinaBotswanaBrazilBrunei DarussalamBulgariaBurkina FasoBurundiCabo VerdeCambodiaCameroonCanadaCaribbean small statesCentral African RepublicCentral Europe and the BalticsChadChileChinaColombiaComorosCongo, Dem. Rep.Congo, Rep.Costa RicaCote d'IvoireCroatiaCubaCyprusCzech RepublicDenmarkDjiboutiDominicaDominican RepublicEarly-demographic dividendEast Asia & PacificEast Asia & Pacific (excluding high income)East Asia & Pacific (IDA & IBRD countries)EcuadorEgypt, Arab Rep.El SalvadorEquatorial GuineaEritreaEstoniaEthiopiaEuro areaEurope & Central AsiaEurope & Central Asia (excluding high income)Europe & Central Asia (IDA & IBRD countries)European UnionFaroe IslandsFijiFinlandFragile and conflict affected situationsFranceFrench PolynesiaGabonGambia, TheGeorgiaGermanyGhanaGreeceGrenadaGuatemalaGuineaGuinea-BissauGuyanaHaitiHeavily indebted poor countries (HIPC)High incomeHondurasHong Kong SAR, ChinaHungaryIBRD onlyIcelandIDA & IBRD totalIDA blendIDA onlyIDA totalIndiaIndonesiaIran, Islamic Rep.IraqIrelandIsraelItalyJamaicaJapanJordanKazakhstanKenyaKiribatiKorea, Rep.KosovoKuwaitKyrgyz RepublicLao PDRLate-demographic dividendLatin America & Caribbean Latin America & Caribbean (excluding high income)Latin America & the Caribbean (IDA & IBRD countries)LatviaLeast developed countries: UN classificationLebanonLesothoLiberiaLibyaLithuaniaLow & middle incomeLow incomeLower middle incomeLuxembourgMacao SAR, ChinaMacedonia, FYRMadagascarMalawiMalaysiaMaldivesMaliMaltaMauritaniaMauritiusMexicoMicronesia, Fed. Sts.Middle East & North AfricaMiddle East & North Africa (excluding high income)Middle East & North Africa (IDA & IBRD countries)Middle incomeMoldovaMongoliaMontenegroMoroccoMozambiqueMyanmarNamibiaNepalNetherlandsNew CaledoniaNew ZealandNicaraguaNigerNigeriaNorth AmericaNorwayOECD membersOmanOther small statesPacific island small statesPakistanPalauPanamaPapua New GuineaParaguayPeruPhilippinesPolandPortugalPost-demographic dividendPre-demographic dividendPuerto RicoQatarRomaniaRussian FederationRwandaSamoaSaudi ArabiaSenegalSerbiaSeychellesSierra LeoneSingaporeSlovak RepublicSloveniaSmall statesSolomon IslandsSomaliaSouth AfricaSouth AsiaSouth Asia (IDA & IBRD)South SudanSpainSri LankaSt. Kitts and NevisSt. LuciaSt. Vincent and the GrenadinesSub-Saharan Africa Sub-Saharan Africa (excluding high income)Sub-Saharan Africa (IDA & IBRD countries)SudanSurinameSwazilandSwedenSwitzerlandSyrian Arab RepublicTajikistanTanzaniaThailandTimor-LesteTogoTongaTrinidad and TobagoTunisiaTurkeyTurkmenistanUgandaUkraineUnited Arab EmiratesUnited KingdomUnited StatesUpper middle incomeUruguayUzbekistanVanuatuVenezuela, RBVietnamWest Bank and GazaWorldYemen, Rep.ZambiaZimbabwe línea de tiempo (timeline):
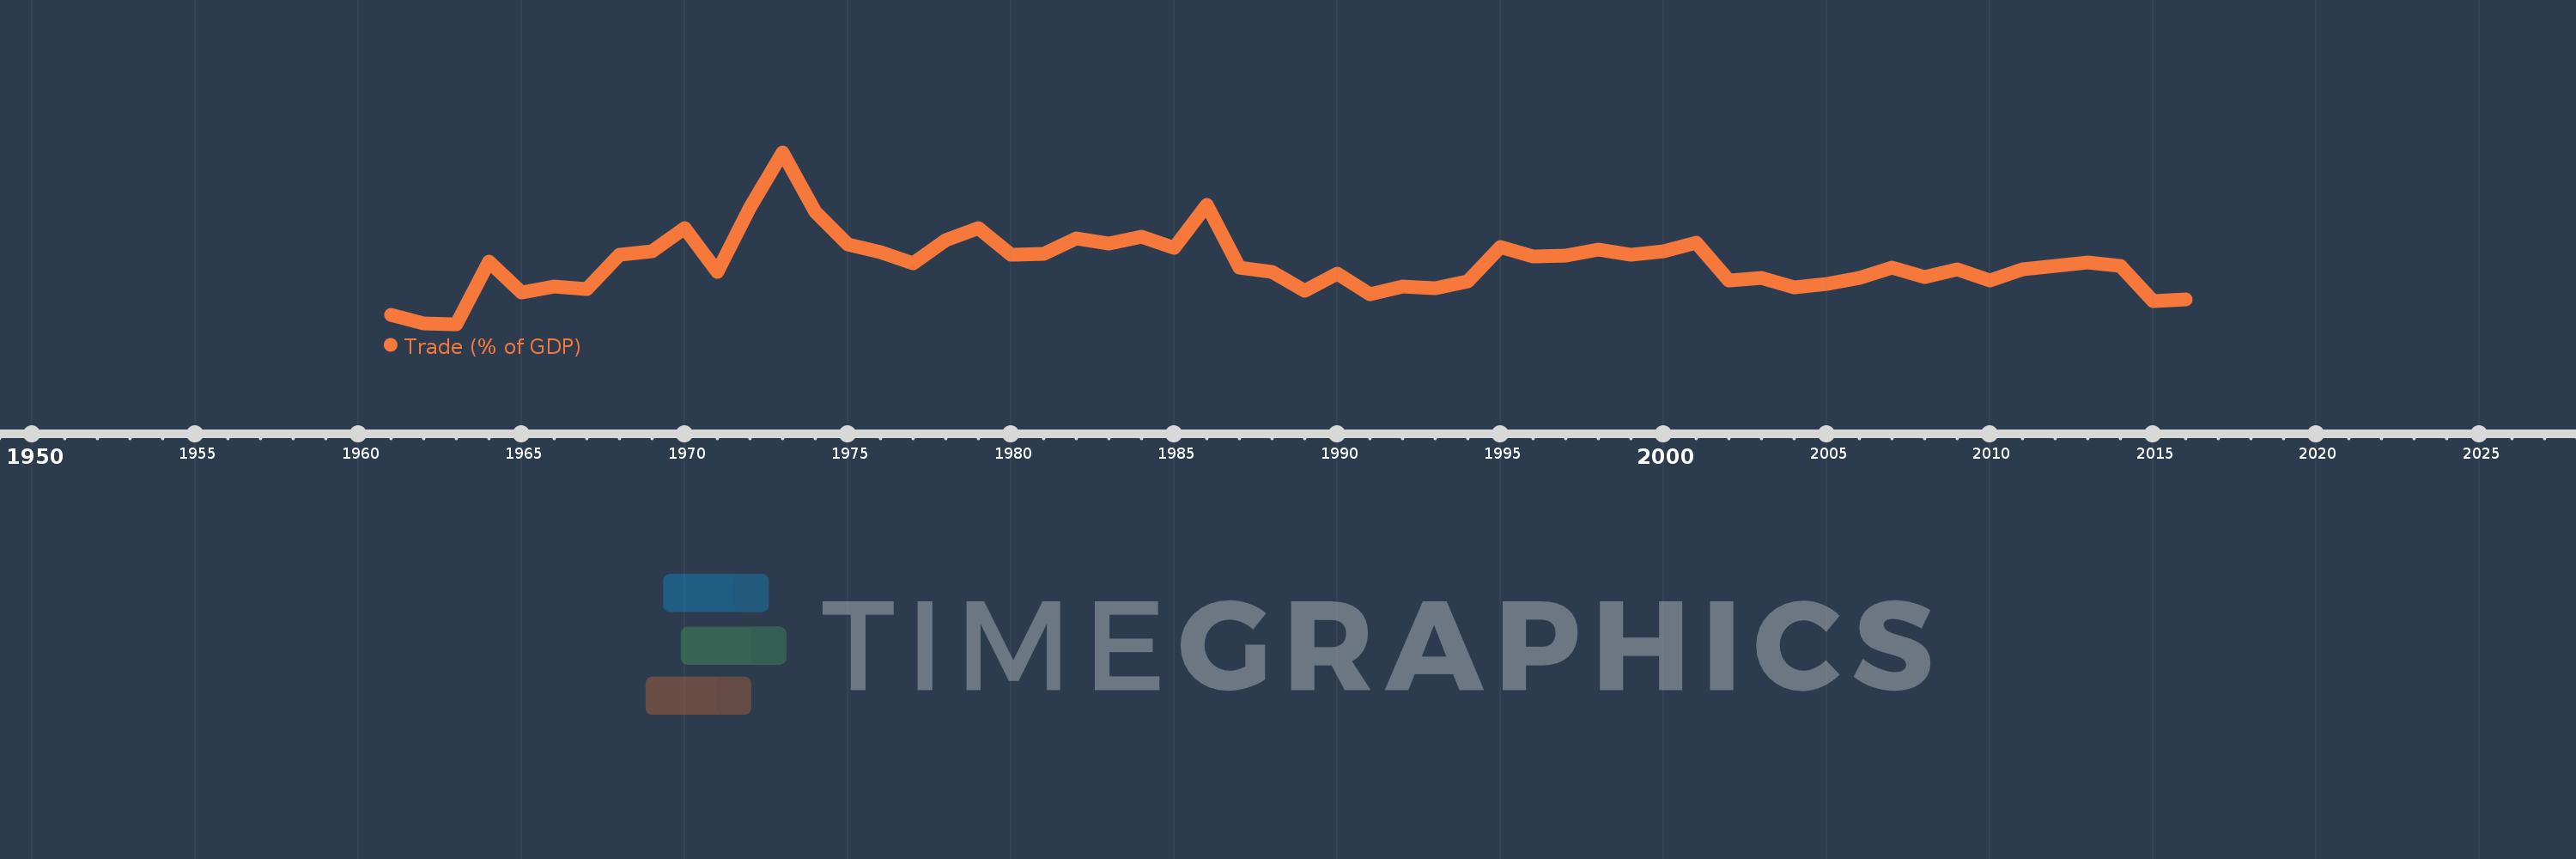
En esta escala de tiempo se presenta un gráfico de 1961 y 2016 de Gabon. Los datos de 1960 están ausentes. El número de observaciones reales por fecha: 56.
Fuente (nombre):
Indicadores del desarrollo mundial
Fuente (organización):
World Bank national accounts data, and OECD National Accounts data files.
Categorías:
Economy & Growth, Trade
Se ha actualizado:
23 abr 2017 año
Los indicadores de los cambios de valor en los últimos años
Mínimo:
62.483
1 ene 1963 año
Máximo:
145.345
1 ene 1973 año
A la fecha de observación
Valor
Cambio absoluto
El cambio con respecto al valor anterior
1 ene 1961 año
66.798
+66.798
0.0%
1 ene 1962 año
62.875
-3.924
-5.87%
1 ene 1963 año
62.483
-0.392
-0.62%
1 ene 1964 año
92.497
+30.014
48.04%
1 ene 1965 año
77.843
-14.653
-15.84%
1 ene 1966 año
80.541
+2.697
3.46%
1 ene 1967 año
79.305
-1.236
-1.53%
1 ene 1968 año
96.108
+16.803
21.19%
1 ene 1969 año
97.668
+1.56
1.62%
1 ene 1970 año
108.706
+11.038
11.3%
1 ene 1971 año
87.709
-20.997
-19.32%
1 ene 1972 año
118.649
+30.939
35.27%
1 ene 1973 año
145.345
+26.697
22.5%
1 ene 1974 año
116.511
-28.834
-19.84%
1 ene 1975 año
100.807
-15.704
-13.48%
1 ene 1976 año
97.426
-3.381
-3.35%
1 ene 1977 año
91.684
-5.742
-5.89%
1 ene 1978 año
102.854
+11.17
12.18%
1 ene 1979 año
108.68
+5.825
5.66%
1 ene 1980 año
95.889
-12.791
-11.77%
1 ene 1981 año
96.35
+0.461
0.48%
1 ene 1982 año
104.059
+7.709
8.0%
1 ene 1983 año
101.262
-2.797
-2.69%
1 ene 1984 año
104.867
+3.606
3.56%
1 ene 1985 año
99.293
-5.574
-5.32%
1 ene 1986 año
119.853
+20.56
20.71%
1 ene 1987 año
89.896
-29.958
-25.0%
1 ene 1988 año
87.914
-1.981
-2.2%
1 ene 1989 año
78.522
-9.392
-10.68%
1 ene 1990 año
86.994
+8.472
10.79%
1 ene 1991 año
76.897
-10.096
-11.61%
1 ene 1992 año
80.535
+3.637
4.73%
1 ene 1993 año
79.869
-0.666
-0.83%
1 ene 1994 año
83.343
+3.474
4.35%
1 ene 1995 año
99.927
+16.584
19.9%
1 ene 1996 año
95.135
-4.792
-4.8%
1 ene 1997 año
95.671
+0.536
0.56%
1 ene 1998 año
98.536
+2.865
3.0%
1 ene 1999 año
95.975
-2.561
-2.6%
1 ene 2000 año
97.731
+1.757
1.83%
1 ene 2001 año
101.702
+3.97
4.06%
1 ene 2002 año
83.639
-18.063
-17.76%
1 ene 2003 año
84.759
+1.12
1.34%
1 ene 2004 año
80.303
-4.456
-5.26%
1 ene 2005 año
81.768
+1.465
1.82%
1 ene 2006 año
84.751
+2.983
3.65%
1 ene 2007 año
89.771
+5.021
5.92%
1 ene 2008 año
85.132
-4.639
-5.17%
1 ene 2009 año
88.999
+3.866
4.54%
1 ene 2010 año
83.505
-5.494
-6.17%
1 ene 2011 año
89.158
+5.653
6.77%
1 ene 2012 año
90.498
+1.341
1.5%
1 ene 2013 año
92.343
+1.844
2.04%
1 ene 2014 año
90.635
-1.708
-1.85%
1 ene 2015 año
73.52
-17.115
-18.88%
1 ene 2016 año
74.392
+0.872
1.19%
Ranking de los países por los datos estadísticos actuales


Comentarios: