29
/es/
es
AIzaSyAYiBZKx7MnpbEhh9jyipgxe19OcubqV5w
April 1, 2024
209864
New Zealand
NZL
true
2
1
Trade (% of GDP)
2015,2014,2013,2012,2011,2010,2009,2008,2007,2006,2005,2004,2003,2002,2001,2000,1999,1998,1997,1996,1995,1994,1993,1992,1991,1990,1989,1988,1987,1986,1985,1984,1983,1982,1981,1980,1979,1978,1977,1976,1975,1974,1973,1972
Estas estadísticas en otros países:
AfghanistanAlbaniaAlgeriaAngolaAntigua and BarbudaArab WorldArgentinaArmeniaArubaAustraliaAustriaAzerbaijanBahamas, TheBahrainBangladeshBarbadosBelarusBelgiumBelizeBeninBermudaBhutanBoliviaBosnia and HerzegovinaBotswanaBrazilBrunei DarussalamBulgariaBurkina FasoBurundiCabo VerdeCambodiaCameroonCanadaCaribbean small statesCentral African RepublicCentral Europe and the BalticsChadChileChinaColombiaComorosCongo, Dem. Rep.Congo, Rep.Costa RicaCote d'IvoireCroatiaCubaCyprusCzech RepublicDenmarkDjiboutiDominicaDominican RepublicEarly-demographic dividendEast Asia & PacificEast Asia & Pacific (excluding high income)East Asia & Pacific (IDA & IBRD countries)EcuadorEgypt, Arab Rep.El SalvadorEquatorial GuineaEritreaEstoniaEthiopiaEuro areaEurope & Central AsiaEurope & Central Asia (excluding high income)Europe & Central Asia (IDA & IBRD countries)European UnionFaroe IslandsFijiFinlandFragile and conflict affected situationsFranceFrench PolynesiaGabonGambia, TheGeorgiaGermanyGhanaGreeceGrenadaGuatemalaGuineaGuinea-BissauGuyanaHaitiHeavily indebted poor countries (HIPC)High incomeHondurasHong Kong SAR, ChinaHungaryIBRD onlyIcelandIDA & IBRD totalIDA blendIDA onlyIDA totalIndiaIndonesiaIran, Islamic Rep.IraqIrelandIsraelItalyJamaicaJapanJordanKazakhstanKenyaKiribatiKorea, Rep.KosovoKuwaitKyrgyz RepublicLao PDRLate-demographic dividendLatin America & Caribbean Latin America & Caribbean (excluding high income)Latin America & the Caribbean (IDA & IBRD countries)LatviaLeast developed countries: UN classificationLebanonLesothoLiberiaLibyaLithuaniaLow & middle incomeLow incomeLower middle incomeLuxembourgMacao SAR, ChinaMacedonia, FYRMadagascarMalawiMalaysiaMaldivesMaliMaltaMauritaniaMauritiusMexicoMicronesia, Fed. Sts.Middle East & North AfricaMiddle East & North Africa (excluding high income)Middle East & North Africa (IDA & IBRD countries)Middle incomeMoldovaMongoliaMontenegroMoroccoMozambiqueMyanmarNamibiaNepalNetherlandsNew CaledoniaNew ZealandNicaraguaNigerNigeriaNorth AmericaNorwayOECD membersOmanOther small statesPacific island small statesPakistanPalauPanamaPapua New GuineaParaguayPeruPhilippinesPolandPortugalPost-demographic dividendPre-demographic dividendPuerto RicoQatarRomaniaRussian FederationRwandaSamoaSaudi ArabiaSenegalSerbiaSeychellesSierra LeoneSingaporeSlovak RepublicSloveniaSmall statesSolomon IslandsSomaliaSouth AfricaSouth AsiaSouth Asia (IDA & IBRD)South SudanSpainSri LankaSt. Kitts and NevisSt. LuciaSt. Vincent and the GrenadinesSub-Saharan Africa Sub-Saharan Africa (excluding high income)Sub-Saharan Africa (IDA & IBRD countries)SudanSurinameSwazilandSwedenSwitzerlandSyrian Arab RepublicTajikistanTanzaniaThailandTimor-LesteTogoTongaTrinidad and TobagoTunisiaTurkeyTurkmenistanUgandaUkraineUnited Arab EmiratesUnited KingdomUnited StatesUpper middle incomeUruguayUzbekistanVanuatuVenezuela, RBVietnamWest Bank and GazaWorldYemen, Rep.ZambiaZimbabwe línea de tiempo (timeline):
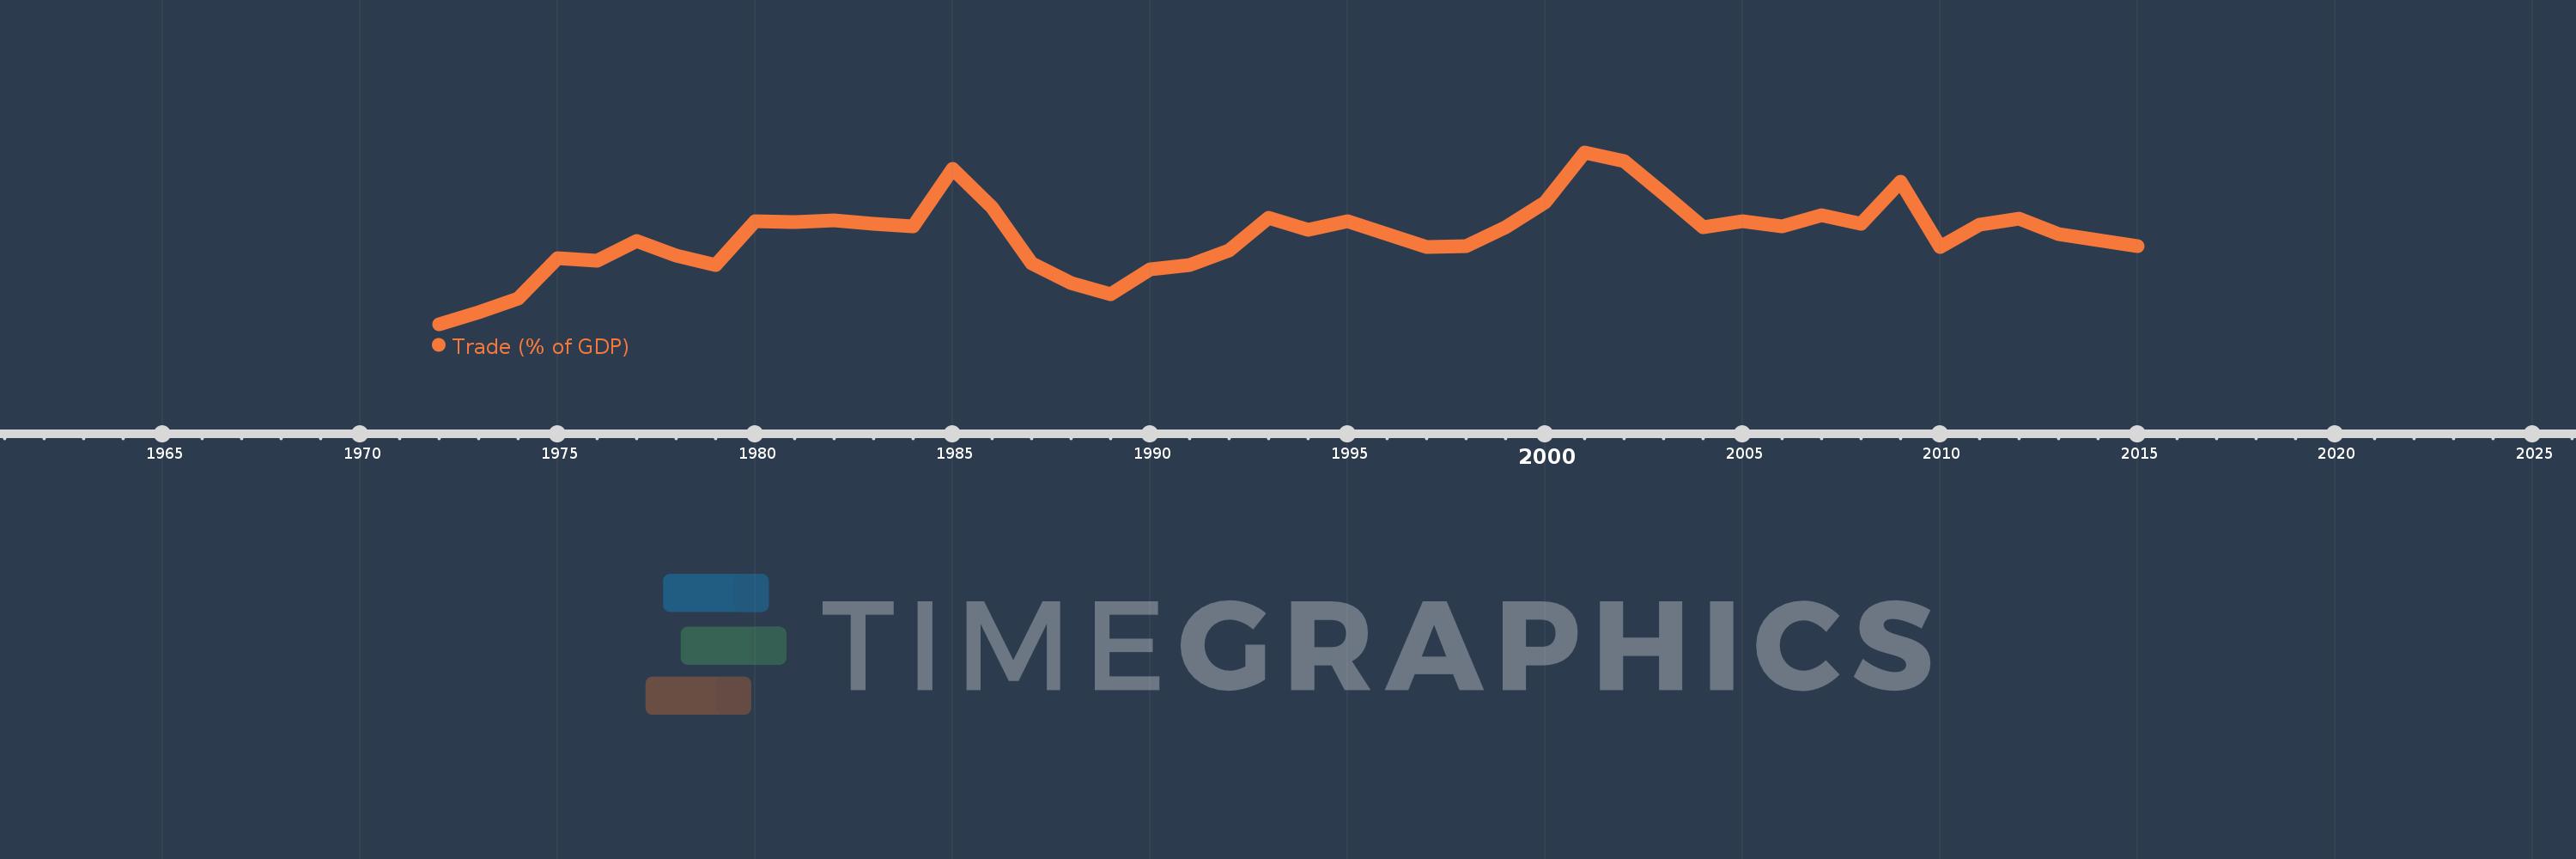
En esta escala de tiempo se presenta un gráfico de 1972 y 2015 de New Zealand. Los datos de 1971 están ausentes. El número de observaciones reales por fecha: 44.
Fuente (nombre):
Indicadores del desarrollo mundial
Fuente (organización):
World Bank national accounts data, and OECD National Accounts data files.
Categorías:
Economy & Growth, Trade
Se ha actualizado:
23 abr 2017 año
Los indicadores de los cambios de valor en los últimos años
Mínimo:
44.18
1 ene 1972 año
Máximo:
68.518
1 ene 2001 año
A la fecha de observación
Valor
Cambio absoluto
El cambio con respecto al valor anterior
1 ene 1972 año
44.18
+44.18
0.0%
1 ene 1973 año
45.859
+1.678
3.8%
1 ene 1974 año
47.864
+2.006
4.37%
1 ene 1975 año
53.556
+5.692
11.89%
1 ene 1976 año
53.135
-0.421
-0.79%
1 ene 1977 año
55.944
+2.809
5.29%
1 ene 1978 año
53.9
-2.044
-3.65%
1 ene 1979 año
52.547
-1.353
-2.51%
1 ene 1980 año
58.811
+6.265
11.92%
1 ene 1981 año
58.691
-0.12
-0.2%
1 ene 1982 año
58.875
+0.184
0.31%
1 ene 1983 año
58.442
-0.433
-0.74%
1 ene 1984 año
57.994
-0.448
-0.77%
1 ene 1985 año
66.2
+8.205
14.15%
1 ene 1986 año
60.742
-5.458
-8.24%
1 ene 1987 año
52.769
-7.973
-13.13%
1 ene 1988 año
50.005
-2.764
-5.24%
1 ene 1989 año
48.405
-1.601
-3.2%
1 ene 1990 año
51.979
+3.574
7.38%
1 ene 1991 año
52.607
+0.629
1.21%
1 ene 1992 año
54.636
+2.028
3.86%
1 ene 1993 año
59.235
+4.599
8.42%
1 ene 1994 año
57.554
-1.68
-2.84%
1 ene 1995 año
58.814
+1.26
2.19%
1 ene 1996 año
56.914
-1.9
-3.23%
1 ene 1997 año
55.116
-1.798
-3.16%
1 ene 1998 año
55.247
+0.131
0.24%
1 ene 1999 año
57.897
+2.649
4.8%
1 ene 2000 año
61.406
+3.509
6.06%
1 ene 2001 año
68.518
+7.112
11.58%
1 ene 2002 año
67.234
-1.284
-1.87%
1 ene 2003 año
62.656
-4.578
-6.81%
1 ene 2004 año
57.915
-4.741
-7.57%
1 ene 2005 año
58.8
+0.885
1.53%
1 ene 2006 año
58.02
-0.78
-1.33%
1 ene 2007 año
59.567
+1.547
2.67%
1 ene 2008 año
58.372
-1.195
-2.01%
1 ene 2009 año
64.337
+5.966
10.22%
1 ene 2010 año
55.162
-9.175
-14.26%
1 ene 2011 año
58.226
+3.064
5.55%
1 ene 2012 año
59.181
+0.954
1.64%
1 ene 2013 año
56.889
-2.292
-3.87%
1 ene 2014 año
56.045
-0.844
-1.48%
1 ene 2015 año
55.235
-0.81
-1.44%
Ranking de los países por los datos estadísticos actuales


Comentarios: