29
/es/
es
AIzaSyAYiBZKx7MnpbEhh9jyipgxe19OcubqV5w
April 1, 2024
101671
Canada
CAN
true
2
1
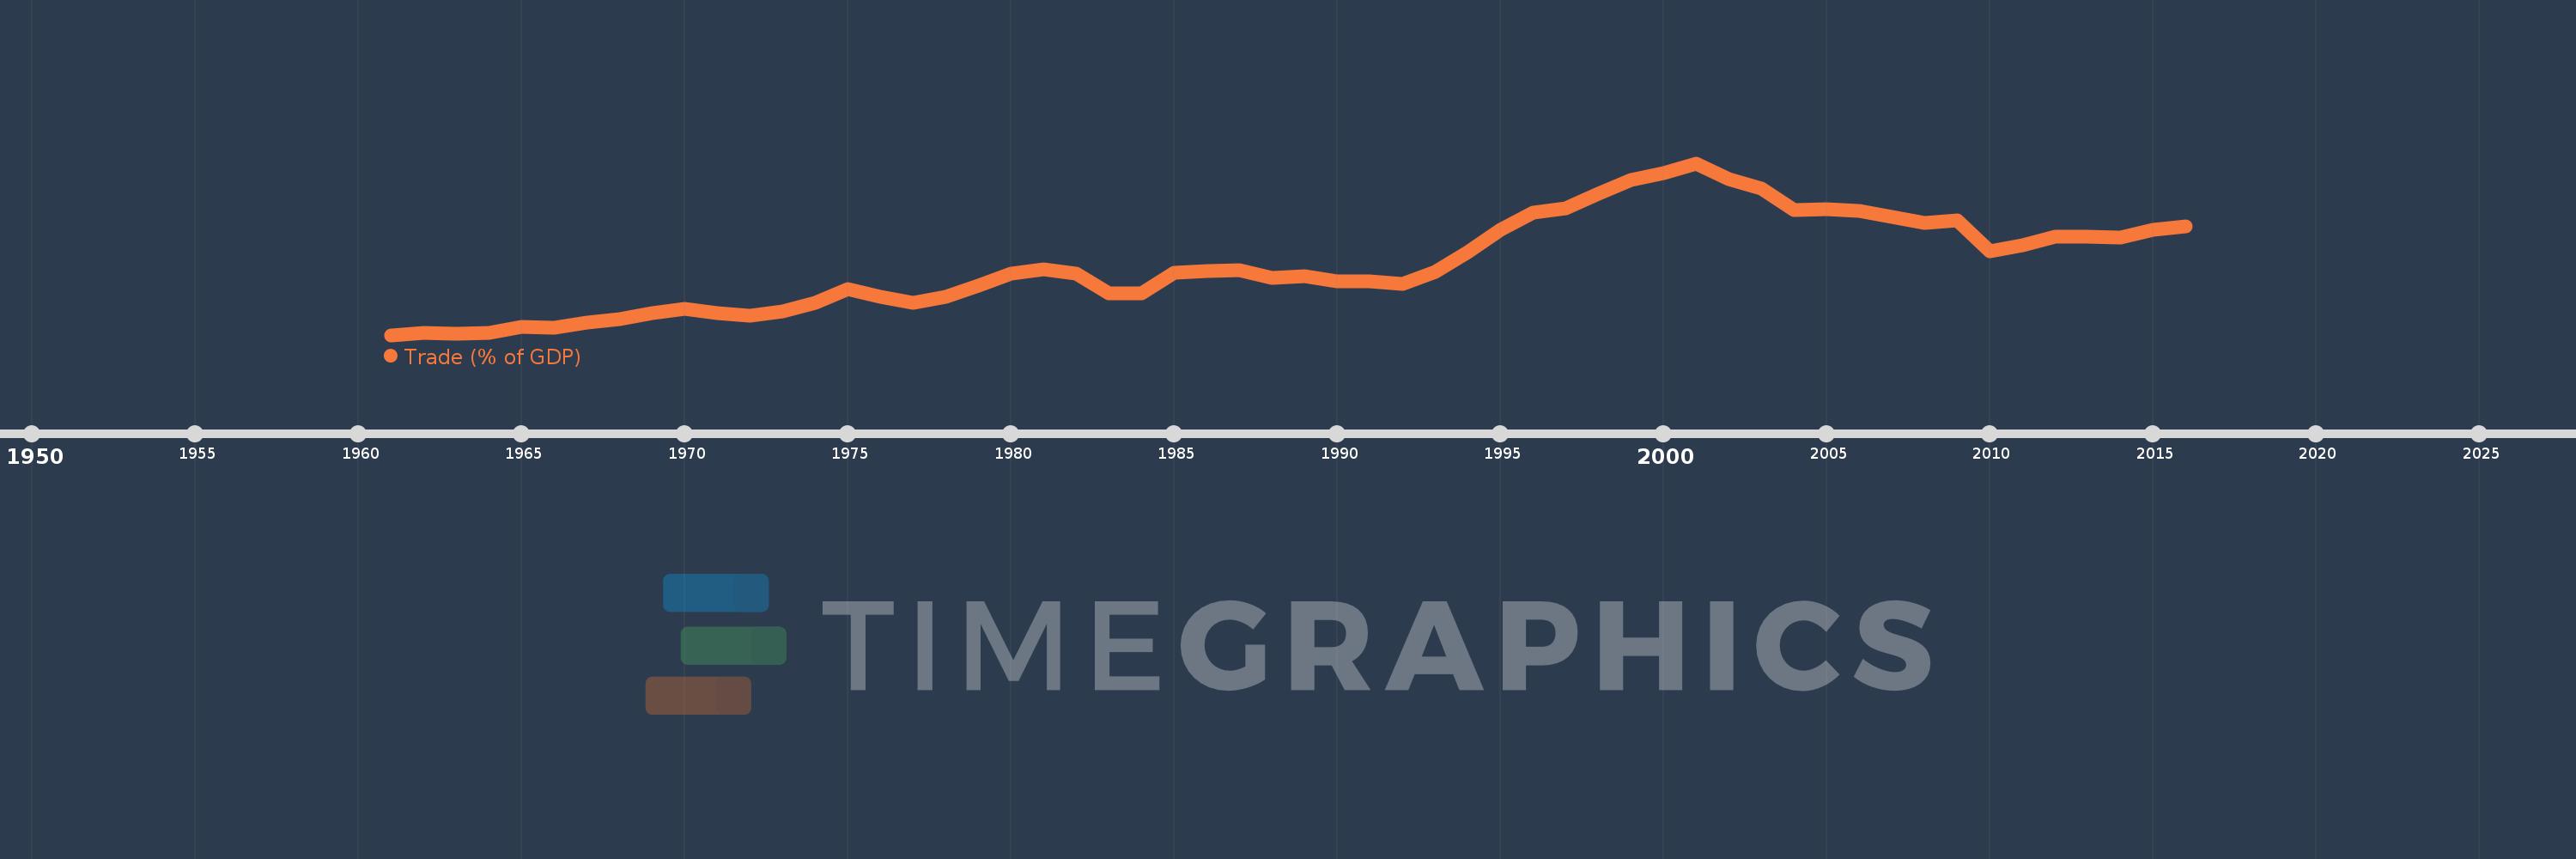
Trade (% of GDP)
2016,2015,2014,2013,2012,2011,2010,2009,2008,2007,2006,2005,2004,2003,2002,2001,2000,1999,1998,1997,1996,1995,1994,1993,1992,1991,1990,1989,1988,1987,1986,1985,1984,1983,1982,1981,1980,1979,1978,1977,1976,1975,1974,1973,1972,1971,1970,1969,1968,1967,1966,1965,1964,1963,1962,1961
Estas estadísticas en otros países:
AfghanistanAlbaniaAlgeriaAngolaAntigua and BarbudaArab WorldArgentinaArmeniaArubaAustraliaAustriaAzerbaijanBahamas, TheBahrainBangladeshBarbadosBelarusBelgiumBelizeBeninBermudaBhutanBoliviaBosnia and HerzegovinaBotswanaBrazilBrunei DarussalamBulgariaBurkina FasoBurundiCabo VerdeCambodiaCameroonCanadaCaribbean small statesCentral African RepublicCentral Europe and the BalticsChadChileChinaColombiaComorosCongo, Dem. Rep.Congo, Rep.Costa RicaCote d'IvoireCroatiaCubaCyprusCzech RepublicDenmarkDjiboutiDominicaDominican RepublicEarly-demographic dividendEast Asia & PacificEast Asia & Pacific (excluding high income)East Asia & Pacific (IDA & IBRD countries)EcuadorEgypt, Arab Rep.El SalvadorEquatorial GuineaEritreaEstoniaEthiopiaEuro areaEurope & Central AsiaEurope & Central Asia (excluding high income)Europe & Central Asia (IDA & IBRD countries)European UnionFaroe IslandsFijiFinlandFragile and conflict affected situationsFranceFrench PolynesiaGabonGambia, TheGeorgiaGermanyGhanaGreeceGrenadaGuatemalaGuineaGuinea-BissauGuyanaHaitiHeavily indebted poor countries (HIPC)High incomeHondurasHong Kong SAR, ChinaHungaryIBRD onlyIcelandIDA & IBRD totalIDA blendIDA onlyIDA totalIndiaIndonesiaIran, Islamic Rep.IraqIrelandIsraelItalyJamaicaJapanJordanKazakhstanKenyaKiribatiKorea, Rep.KosovoKuwaitKyrgyz RepublicLao PDRLate-demographic dividendLatin America & Caribbean Latin America & Caribbean (excluding high income)Latin America & the Caribbean (IDA & IBRD countries)LatviaLeast developed countries: UN classificationLebanonLesothoLiberiaLibyaLithuaniaLow & middle incomeLow incomeLower middle incomeLuxembourgMacao SAR, ChinaMacedonia, FYRMadagascarMalawiMalaysiaMaldivesMaliMaltaMauritaniaMauritiusMexicoMicronesia, Fed. Sts.Middle East & North AfricaMiddle East & North Africa (excluding high income)Middle East & North Africa (IDA & IBRD countries)Middle incomeMoldovaMongoliaMontenegroMoroccoMozambiqueMyanmarNamibiaNepalNetherlandsNew CaledoniaNew ZealandNicaraguaNigerNigeriaNorth AmericaNorwayOECD membersOmanOther small statesPacific island small statesPakistanPalauPanamaPapua New GuineaParaguayPeruPhilippinesPolandPortugalPost-demographic dividendPre-demographic dividendPuerto RicoQatarRomaniaRussian FederationRwandaSamoaSaudi ArabiaSenegalSerbiaSeychellesSierra LeoneSingaporeSlovak RepublicSloveniaSmall statesSolomon IslandsSomaliaSouth AfricaSouth AsiaSouth Asia (IDA & IBRD)South SudanSpainSri LankaSt. Kitts and NevisSt. LuciaSt. Vincent and the GrenadinesSub-Saharan Africa Sub-Saharan Africa (excluding high income)Sub-Saharan Africa (IDA & IBRD countries)SudanSurinameSwazilandSwedenSwitzerlandSyrian Arab RepublicTajikistanTanzaniaThailandTimor-LesteTogoTongaTrinidad and TobagoTunisiaTurkeyTurkmenistanUgandaUkraineUnited Arab EmiratesUnited KingdomUnited StatesUpper middle incomeUruguayUzbekistanVanuatuVenezuela, RBVietnamWest Bank and GazaWorldYemen, Rep.ZambiaZimbabwe línea de tiempo (timeline):
En esta escala de tiempo se presenta un gráfico de 1961 y 2016 de Canada. Los datos de 1960 están ausentes. El número de observaciones reales por fecha: 56.
Fuente (nombre):
Indicadores del desarrollo mundial
Fuente (organización):
World Bank national accounts data, and OECD National Accounts data files.
Categorías:
Economy & Growth, Trade
Se ha actualizado:
23 abr 2017 año
Los indicadores de los cambios de valor en los últimos años
Mínimo:
35.102
1 ene 1961 año
Máximo:
82.858
1 ene 2001 año
A la fecha de observación
Valor
Cambio absoluto
El cambio con respecto al valor anterior
1 ene 1961 año
35.102
+35.102
0.0%
1 ene 1962 año
35.805
+0.703
2.0%
1 ene 1963 año
35.575
-0.229
-0.64%
1 ene 1964 año
35.703
+0.127
0.36%
1 ene 1965 año
37.342
+1.64
4.59%
1 ene 1966 año
37.189
-0.153
-0.41%
1 ene 1967 año
38.643
+1.454
3.91%
1 ene 1968 año
39.521
+0.878
2.27%
1 ene 1969 año
41.18
+1.659
4.2%
1 ene 1970 año
42.388
+1.208
2.93%
1 ene 1971 año
41.303
-1.086
-2.56%
1 ene 1972 año
40.477
-0.826
-2.0%
1 ene 1973 año
41.643
+1.166
2.88%
1 ene 1974 año
44.11
+2.467
5.92%
1 ene 1975 año
47.971
+3.861
8.75%
1 ene 1976 año
45.746
-2.225
-4.64%
1 ene 1977 año
44.165
-1.58
-3.45%
1 ene 1978 año
45.668
+1.503
3.4%
1 ene 1979 año
48.792
+3.123
6.84%
1 ene 1980 año
52.205
+3.413
7.0%
1 ene 1981 año
53.296
+1.091
2.09%
1 ene 1982 año
52.115
-1.181
-2.22%
1 ene 1983 año
46.603
-5.512
-10.58%
1 ene 1984 año
46.69
+0.087
0.19%
1 ene 1985 año
52.475
+5.785
12.39%
1 ene 1986 año
52.862
+0.387
0.74%
1 ene 1987 año
53.082
+0.22
0.42%
1 ene 1988 año
50.87
-2.213
-4.17%
1 ene 1989 año
51.363
+0.493
0.97%
1 ene 1990 año
50.049
-1.314
-2.56%
1 ene 1991 año
49.967
-0.082
-0.16%
1 ene 1992 año
49.202
-0.765
-1.53%
1 ene 1993 año
52.717
+3.515
7.14%
1 ene 1994 año
58.245
+5.527
10.48%
1 ene 1995 año
64.398
+6.153
10.56%
1 ene 1996 año
69.097
+4.699
7.3%
1 ene 1997 año
70.3
+1.202
1.74%
1 ene 1998 año
74.385
+4.086
5.81%
1 ene 1999 año
78.159
+3.774
5.07%
1 ene 2000 año
80.194
+2.035
2.6%
1 ene 2001 año
82.858
+2.664
3.32%
1 ene 2002 año
78.406
-4.451
-5.37%
1 ene 2003 año
75.733
-2.674
-3.41%
1 ene 2004 año
69.843
-5.889
-7.78%
1 ene 2005 año
70.181
+0.337
0.48%
1 ene 2006 año
69.71
-0.471
-0.67%
1 ene 2007 año
67.981
-1.729
-2.48%
1 ene 2008 año
66.192
-1.789
-2.63%
1 ene 2009 año
66.924
+0.732
1.11%
1 ene 2010 año
58.348
-8.576
-12.81%
1 ene 2011 año
60.061
+1.712
2.93%
1 ene 2012 año
62.329
+2.268
3.78%
1 ene 2013 año
62.397
+0.069
0.11%
1 ene 2014 año
62.145
-0.252
-0.4%
1 ene 2015 año
64.256
+2.111
3.4%
1 ene 2016 año
65.38
+1.124
1.75%
Ranking de los países por los datos estadísticos actuales


Comentarios: