29
/es/
es
AIzaSyAYiBZKx7MnpbEhh9jyipgxe19OcubqV5w
April 1, 2024
51574
Middle income
MIC
false
2
1
Trade (% of GDP)
2016,2015,2014,2013,2012,2011,2010,2009,2008,2007,2006,2005,2004,2003,2002,2001,2000,1999,1998,1997,1996,1995,1994,1993,1992,1991,1990,1989,1988,1987,1986,1985,1984,1983,1982,1981,1980,1979,1978,1977,1976,1975,1974,1973,1972,1971,1970,1969,1968,1967,1966,1965,1964,1963,1962,1961
Estas estadísticas en otros países:
AfghanistanAlbaniaAlgeriaAngolaAntigua and BarbudaArab WorldArgentinaArmeniaArubaAustraliaAustriaAzerbaijanBahamas, TheBahrainBangladeshBarbadosBelarusBelgiumBelizeBeninBermudaBhutanBoliviaBosnia and HerzegovinaBotswanaBrazilBrunei DarussalamBulgariaBurkina FasoBurundiCabo VerdeCambodiaCameroonCanadaCaribbean small statesCentral African RepublicCentral Europe and the BalticsChadChileChinaColombiaComorosCongo, Dem. Rep.Congo, Rep.Costa RicaCote d'IvoireCroatiaCubaCyprusCzech RepublicDenmarkDjiboutiDominicaDominican RepublicEarly-demographic dividendEast Asia & PacificEast Asia & Pacific (excluding high income)East Asia & Pacific (IDA & IBRD countries)EcuadorEgypt, Arab Rep.El SalvadorEquatorial GuineaEritreaEstoniaEthiopiaEuro areaEurope & Central AsiaEurope & Central Asia (excluding high income)Europe & Central Asia (IDA & IBRD countries)European UnionFaroe IslandsFijiFinlandFragile and conflict affected situationsFranceFrench PolynesiaGabonGambia, TheGeorgiaGermanyGhanaGreeceGrenadaGuatemalaGuineaGuinea-BissauGuyanaHaitiHeavily indebted poor countries (HIPC)High incomeHondurasHong Kong SAR, ChinaHungaryIBRD onlyIcelandIDA & IBRD totalIDA blendIDA onlyIDA totalIndiaIndonesiaIran, Islamic Rep.IraqIrelandIsraelItalyJamaicaJapanJordanKazakhstanKenyaKiribatiKorea, Rep.KosovoKuwaitKyrgyz RepublicLao PDRLate-demographic dividendLatin America & Caribbean Latin America & Caribbean (excluding high income)Latin America & the Caribbean (IDA & IBRD countries)LatviaLeast developed countries: UN classificationLebanonLesothoLiberiaLibyaLithuaniaLow & middle incomeLow incomeLower middle incomeLuxembourgMacao SAR, ChinaMacedonia, FYRMadagascarMalawiMalaysiaMaldivesMaliMaltaMauritaniaMauritiusMexicoMicronesia, Fed. Sts.Middle East & North AfricaMiddle East & North Africa (excluding high income)Middle East & North Africa (IDA & IBRD countries)Middle incomeMoldovaMongoliaMontenegroMoroccoMozambiqueMyanmarNamibiaNepalNetherlandsNew CaledoniaNew ZealandNicaraguaNigerNigeriaNorth AmericaNorwayOECD membersOmanOther small statesPacific island small statesPakistanPalauPanamaPapua New GuineaParaguayPeruPhilippinesPolandPortugalPost-demographic dividendPre-demographic dividendPuerto RicoQatarRomaniaRussian FederationRwandaSamoaSaudi ArabiaSenegalSerbiaSeychellesSierra LeoneSingaporeSlovak RepublicSloveniaSmall statesSolomon IslandsSomaliaSouth AfricaSouth AsiaSouth Asia (IDA & IBRD)South SudanSpainSri LankaSt. Kitts and NevisSt. LuciaSt. Vincent and the GrenadinesSub-Saharan Africa Sub-Saharan Africa (excluding high income)Sub-Saharan Africa (IDA & IBRD countries)SudanSurinameSwazilandSwedenSwitzerlandSyrian Arab RepublicTajikistanTanzaniaThailandTimor-LesteTogoTongaTrinidad and TobagoTunisiaTurkeyTurkmenistanUgandaUkraineUnited Arab EmiratesUnited KingdomUnited StatesUpper middle incomeUruguayUzbekistanVanuatuVenezuela, RBVietnamWest Bank and GazaWorldYemen, Rep.ZambiaZimbabwe línea de tiempo (timeline):
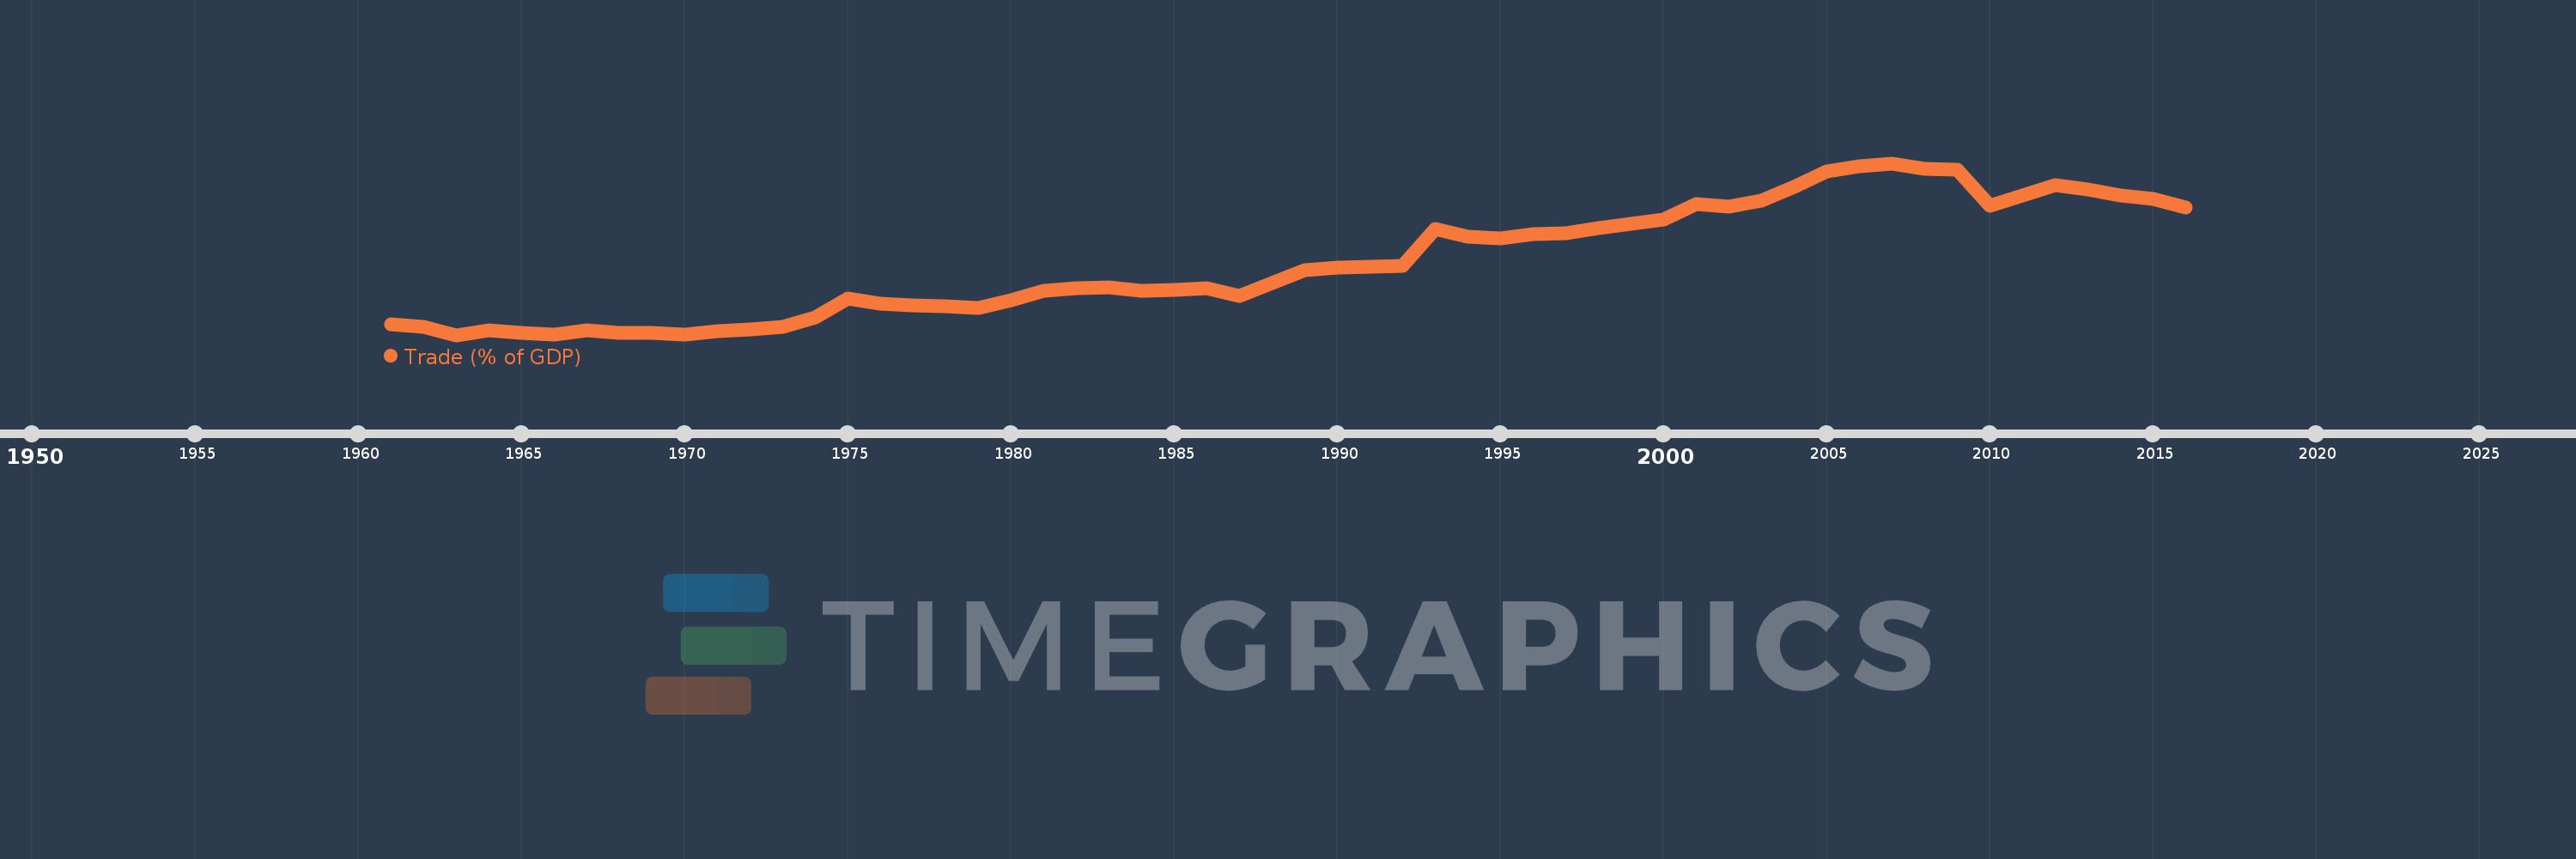
En esta escala de tiempo se presenta un gráfico de 1961 y 2016 de Middle income. Los datos de 1960 están ausentes. El número de observaciones reales por fecha: 56.
Fuente (nombre):
Indicadores del desarrollo mundial
Fuente (organización):
World Bank national accounts data, and OECD National Accounts data files.
Categorías:
Economy & Growth, Trade
Se ha actualizado:
23 abr 2017 año
Los indicadores de los cambios de valor en los últimos años
Mínimo:
17.067
1 ene 1963 año
Máximo:
61.544
1 ene 2007 año
A la fecha de observación
Valor
Cambio absoluto
El cambio con respecto al valor anterior
1 ene 1961 año
19.739
+19.739
0.0%
1 ene 1962 año
19.089
-0.65
-3.29%
1 ene 1963 año
17.067
-2.022
-10.59%
1 ene 1964 año
18.321
+1.255
7.35%
1 ene 1965 año
17.607
-0.714
-3.9%
1 ene 1966 año
17.237
-0.371
-2.11%
1 ene 1967 año
18.254
+1.017
5.9%
1 ene 1968 año
17.546
-0.708
-3.88%
1 ene 1969 año
17.609
+0.063
0.36%
1 ene 1970 año
17.114
-0.495
-2.81%
1 ene 1971 año
18.165
+1.051
6.14%
1 ene 1972 año
18.46
+0.295
1.62%
1 ene 1973 año
19.128
+0.668
3.62%
1 ene 1974 año
21.596
+2.468
12.9%
1 ene 1975 año
26.461
+4.865
22.53%
1 ene 1976 año
25.236
-1.225
-4.63%
1 ene 1977 año
24.691
-0.545
-2.16%
1 ene 1978 año
24.501
-0.19
-0.77%
1 ene 1979 año
24.008
-0.493
-2.01%
1 ene 1980 año
26.178
+2.17
9.04%
1 ene 1981 año
28.448
+2.27
8.67%
1 ene 1982 año
29.09
+0.642
2.26%
1 ene 1983 año
29.488
+0.398
1.37%
1 ene 1984 año
28.509
-0.979
-3.32%
1 ene 1985 año
28.848
+0.34
1.19%
1 ene 1986 año
29.201
+0.352
1.22%
1 ene 1987 año
27.223
-1.978
-6.77%
1 ene 1988 año
30.428
+3.205
11.77%
1 ene 1989 año
33.825
+3.397
11.17%
1 ene 1990 año
34.535
+0.71
2.1%
1 ene 1991 año
34.77
+0.235
0.68%
1 ene 1992 año
34.948
+0.179
0.51%
1 ene 1993 año
44.498
+9.55
27.33%
1 ene 1994 año
42.567
-1.931
-4.34%
1 ene 1995 año
42.044
-0.523
-1.23%
1 ene 1996 año
43.097
+1.052
2.5%
1 ene 1997 año
43.397
+0.301
0.7%
1 ene 1998 año
44.65
+1.253
2.89%
1 ene 1999 año
45.818
+1.168
2.62%
1 ene 2000 año
46.985
+1.166
2.55%
1 ene 2001 año
51.043
+4.059
8.64%
1 ene 2002 año
50.27
-0.773
-1.51%
1 ene 2003 año
51.796
+1.525
3.03%
1 ene 2004 año
55.394
+3.599
6.95%
1 ene 2005 año
59.349
+3.954
7.14%
1 ene 2006 año
60.725
+1.376
2.32%
1 ene 2007 año
61.544
+0.819
1.35%
1 ene 2008 año
60.12
-1.424
-2.31%
1 ene 2009 año
59.857
-0.263
-0.44%
1 ene 2010 año
50.631
-9.226
-15.41%
1 ene 2011 año
53.213
+2.582
5.1%
1 ene 2012 año
55.805
+2.592
4.87%
1 ene 2013 año
54.67
-1.135
-2.03%
1 ene 2014 año
53.274
-1.396
-2.55%
1 ene 2015 año
52.351
-0.923
-1.73%
1 ene 2016 año
49.997
-2.354
-4.5%
Ranking de los países por los datos estadísticos actuales


Comentarios: