29
/es/
es
AIzaSyAYiBZKx7MnpbEhh9jyipgxe19OcubqV5w
April 1, 2024
57829
South Asia (IDA & IBRD)
TSA
false
2
1
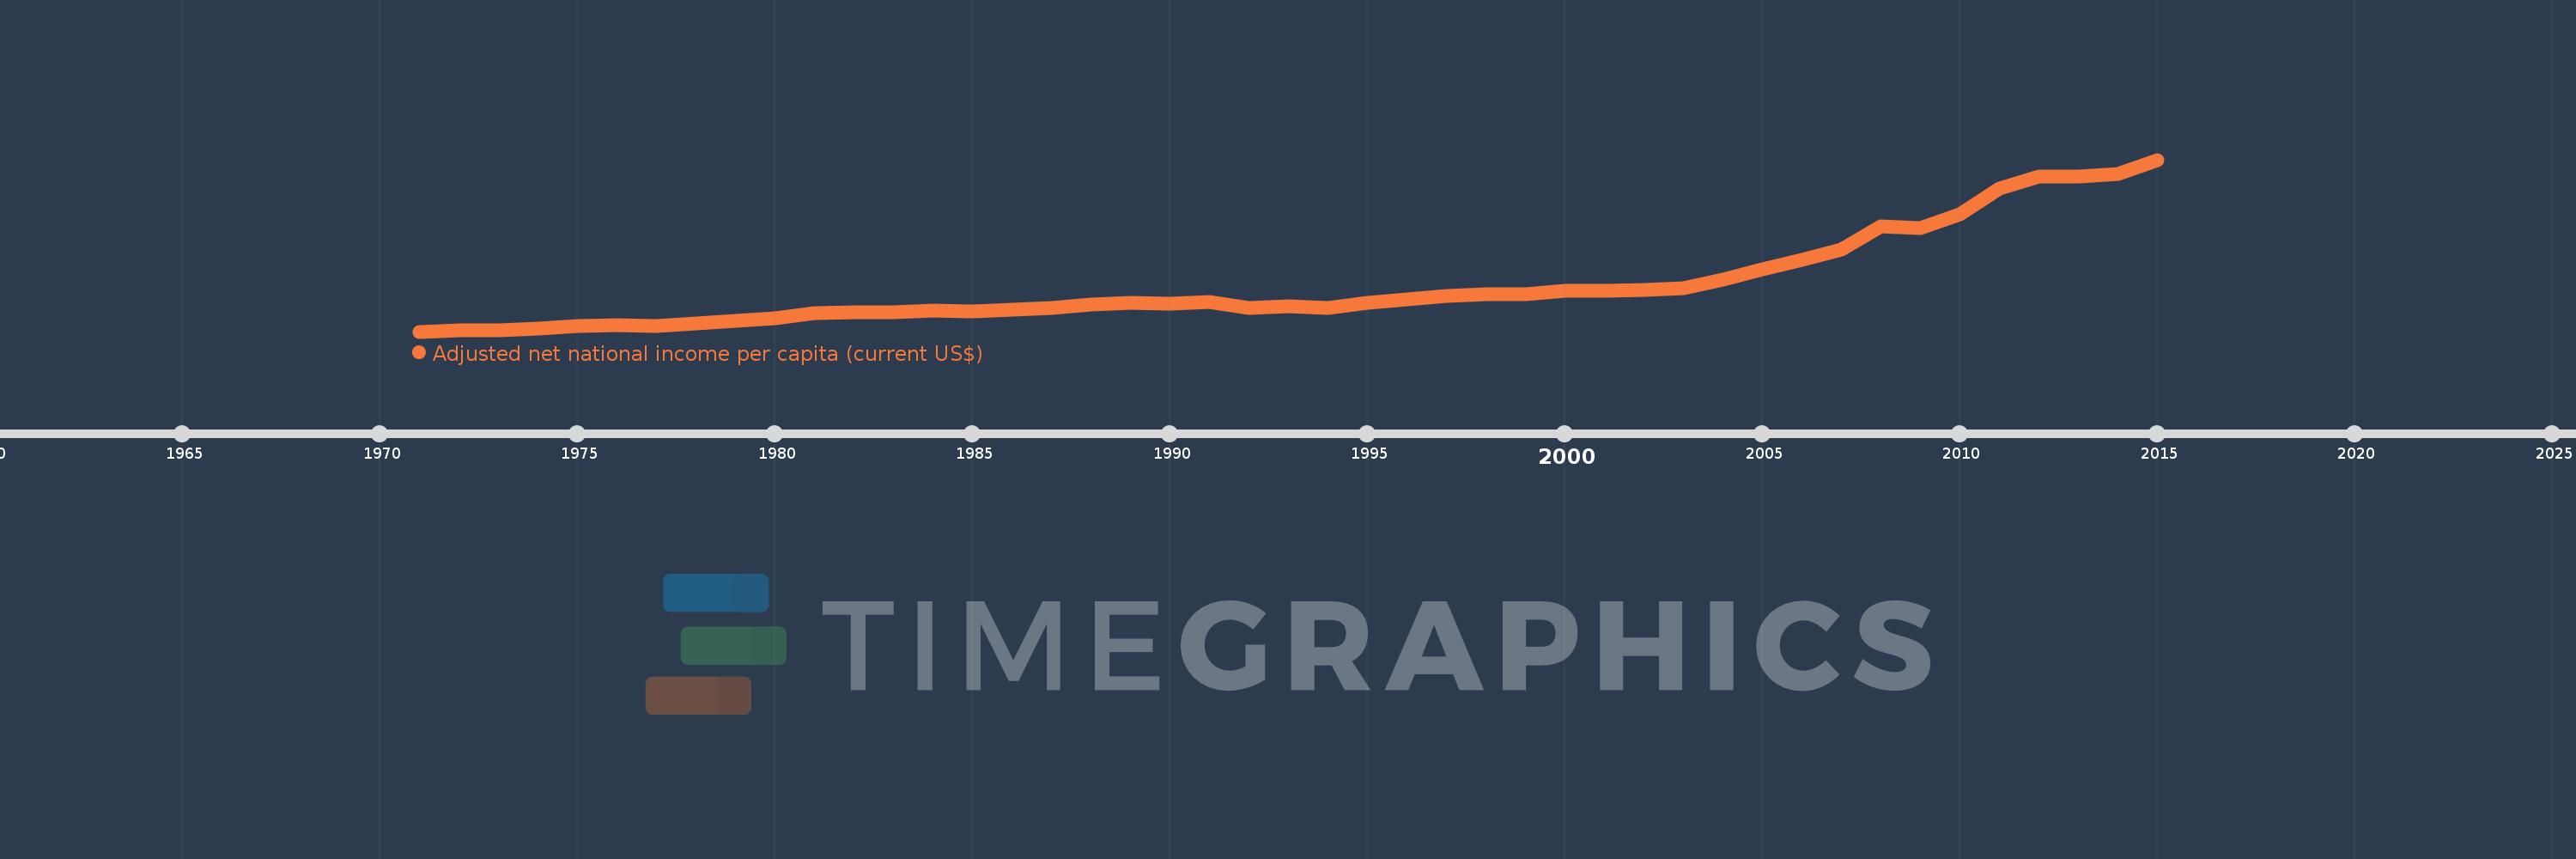
Adjusted net national income per capita (current US$)
2015,2014,2013,2012,2011,2010,2009,2008,2007,2006,2005,2004,2003,2002,2001,2000,1999,1998,1997,1996,1995,1994,1993,1992,1991,1990,1989,1988,1987,1986,1985,1984,1983,1982,1981,1980,1979,1978,1977,1976,1975,1974,1973,1972,1971
Estas estadísticas en otros países:
AfghanistanAlbaniaAlgeriaAngolaArab WorldArgentinaArmeniaAustraliaAustriaAzerbaijanBahamas, TheBahrainBangladeshBarbadosBelarusBelgiumBelizeBeninBhutanBoliviaBotswanaBrazilBrunei DarussalamBulgariaBurkina FasoBurundiCabo VerdeCambodiaCameroonCanadaCaribbean small statesCentral African RepublicCentral Europe and the BalticsChadChileChinaColombiaComorosCongo, Dem. Rep.Congo, Rep.Costa RicaCote d'IvoireCroatiaCubaCyprusCzech RepublicDenmarkDjiboutiDominicaDominican RepublicEarly-demographic dividendEast Asia & PacificEast Asia & Pacific (excluding high income)East Asia & Pacific (IDA & IBRD countries)EcuadorEgypt, Arab Rep.El SalvadorEquatorial GuineaEritreaEstoniaEthiopiaEuro areaEurope & Central AsiaEurope & Central Asia (excluding high income)Europe & Central Asia (IDA & IBRD countries)European UnionFijiFinlandFragile and conflict affected situationsFranceGabonGambia, TheGeorgiaGermanyGhanaGreeceGuatemalaGuineaGuinea-BissauGuyanaHaitiHeavily indebted poor countries (HIPC)High incomeHondurasHong Kong SAR, ChinaHungaryIBRD onlyIcelandIDA & IBRD totalIDA blendIDA onlyIDA totalIndiaIndonesiaIran, Islamic Rep.IraqIrelandIsraelItalyJamaicaJapanJordanKazakhstanKenyaKiribatiKorea, Rep.KuwaitKyrgyz RepublicLao PDRLate-demographic dividendLatin America & Caribbean Latin America & Caribbean (excluding high income)Latin America & the Caribbean (IDA & IBRD countries)LatviaLeast developed countries: UN classificationLebanonLesothoLiberiaLibyaLithuaniaLow & middle incomeLow incomeLower middle incomeLuxembourgMacedonia, FYRMadagascarMalawiMalaysiaMaldivesMaliMauritaniaMauritiusMexicoMiddle East & North AfricaMiddle East & North Africa (excluding high income)Middle East & North Africa (IDA & IBRD countries)Middle incomeMoldovaMongoliaMoroccoMozambiqueMyanmarNamibiaNepalNetherlandsNew ZealandNicaraguaNigerNigeriaNorth AmericaNorwayOECD membersOmanOther small statesPacific island small statesPakistanPanamaPapua New GuineaParaguayPeruPhilippinesPolandPortugalPost-demographic dividendPre-demographic dividendQatarRomaniaRussian FederationRwandaSamoaSao Tome and PrincipeSaudi ArabiaSenegalSeychellesSierra LeoneSingaporeSlovak RepublicSloveniaSmall statesSolomon IslandsSouth AfricaSouth AsiaSouth Asia (IDA & IBRD)SpainSri LankaSt. LuciaSt. Vincent and the GrenadinesSub-Saharan Africa Sub-Saharan Africa (excluding high income)Sub-Saharan Africa (IDA & IBRD countries)SudanSurinameSwazilandSwedenSwitzerlandSyrian Arab RepublicTajikistanTanzaniaThailandTogoTongaTrinidad and TobagoTunisiaTurkeyTurkmenistanUgandaUkraineUnited Arab EmiratesUnited KingdomUnited StatesUpper middle incomeUruguayUzbekistanVanuatuVenezuela, RBVietnamWorldYemen, Rep.ZambiaZimbabwe línea de tiempo (timeline):
En esta escala de tiempo se presenta un gráfico de 1971 y 2015 de South Asia (IDA & IBRD). Los datos de 1970 están ausentes. El número de observaciones reales por fecha: 45.
Fuente (nombre):
Indicadores del desarrollo mundial
Fuente (organización):
World Bank staff estimates based on sources and methods in World Bank's "The Changing Wealth of Nations: Measuring Sustainable Development in the New Millennium" (2011).
Categorías:
Economy & Growth
Se ha actualizado:
23 abr 2017 año
Los indicadores de los cambios de valor en los últimos años
Mínimo:
107.334
1 ene 1971 año
Máximo:
1.314 mil
1 ene 2015 año
A la fecha de observación
Valor
Cambio absoluto
El cambio con respecto al valor anterior
1 ene 1971 año
107.334
+107.334
0.0%
1 ene 1972 año
113.465
+6.131
5.71%
1 ene 1973 año
114.583
+1.118
0.99%
1 ene 1974 año
126.828
+12.245
10.69%
1 ene 1975 año
149.042
+22.215
17.52%
1 ene 1976 año
151.247
+2.205
1.48%
1 ene 1977 año
146.567
-4.681
-3.09%
1 ene 1978 año
165.439
+18.873
12.88%
1 ene 1979 año
185.114
+19.674
11.89%
1 ene 1980 año
200.608
+15.495
8.37%
1 ene 1981 año
235.714
+35.106
17.5%
1 ene 1982 año
244.412
+8.698
3.69%
1 ene 1983 año
242.157
-2.255
-0.92%
1 ene 1984 año
255.018
+12.86
5.31%
1 ene 1985 año
246.81
-8.208
-3.22%
1 ene 1986 año
262.473
+15.664
6.35%
1 ene 1987 año
270.367
+7.894
3.01%
1 ene 1988 año
295.168
+24.801
9.17%
1 ene 1989 año
309.525
+14.357
4.86%
1 ene 1990 año
304.014
-5.512
-1.78%
1 ene 1991 año
316.981
+12.967
4.27%
1 ene 1992 año
273.393
-43.588
-13.75%
1 ene 1993 año
283.993
+10.6
3.88%
1 ene 1994 año
276.072
-7.921
-2.79%
1 ene 1995 año
308.651
+32.579
11.8%
1 ene 1996 año
334.924
+26.274
8.51%
1 ene 1997 año
359.373
+24.448
7.3%
1 ene 1998 año
370.962
+11.59
3.22%
1 ene 1999 año
371.302
+0.34
0.09%
1 ene 2000 año
391.491
+20.188
5.44%
1 ene 2001 año
395.146
+3.655
0.93%
1 ene 2002 año
397.884
+2.738
0.69%
1 ene 2003 año
412.886
+15.002
3.77%
1 ene 2004 año
473.682
+60.796
14.72%
1 ene 2005 año
542.794
+69.112
14.59%
1 ene 2006 año
608.475
+65.68
12.1%
1 ene 2007 año
681.101
+72.626
11.94%
1 ene 2008 año
848.597
+167.496
24.59%
1 ene 2009 año
835.615
-12.981
-1.53%
1 ene 2010 año
933.609
+97.994
11.73%
1 ene 2011 año
1.11 mil
+176.268
18.88%
1 ene 2012 año
1.194 mil
+83.807
7.55%
1 ene 2013 año
1.194 mil
-0.008
0.0%
1 ene 2014 año
1.215 mil
+21.566
1.81%
1 ene 2015 año
1.314 mil
+99.09
8.15%
Ranking de los países por los datos estadísticos actuales


Comentarios: