29
/es/
es
AIzaSyAYiBZKx7MnpbEhh9jyipgxe19OcubqV5w
April 1, 2024
42059
Latin America & Caribbean (excluding high income)
LAC
false
2
1
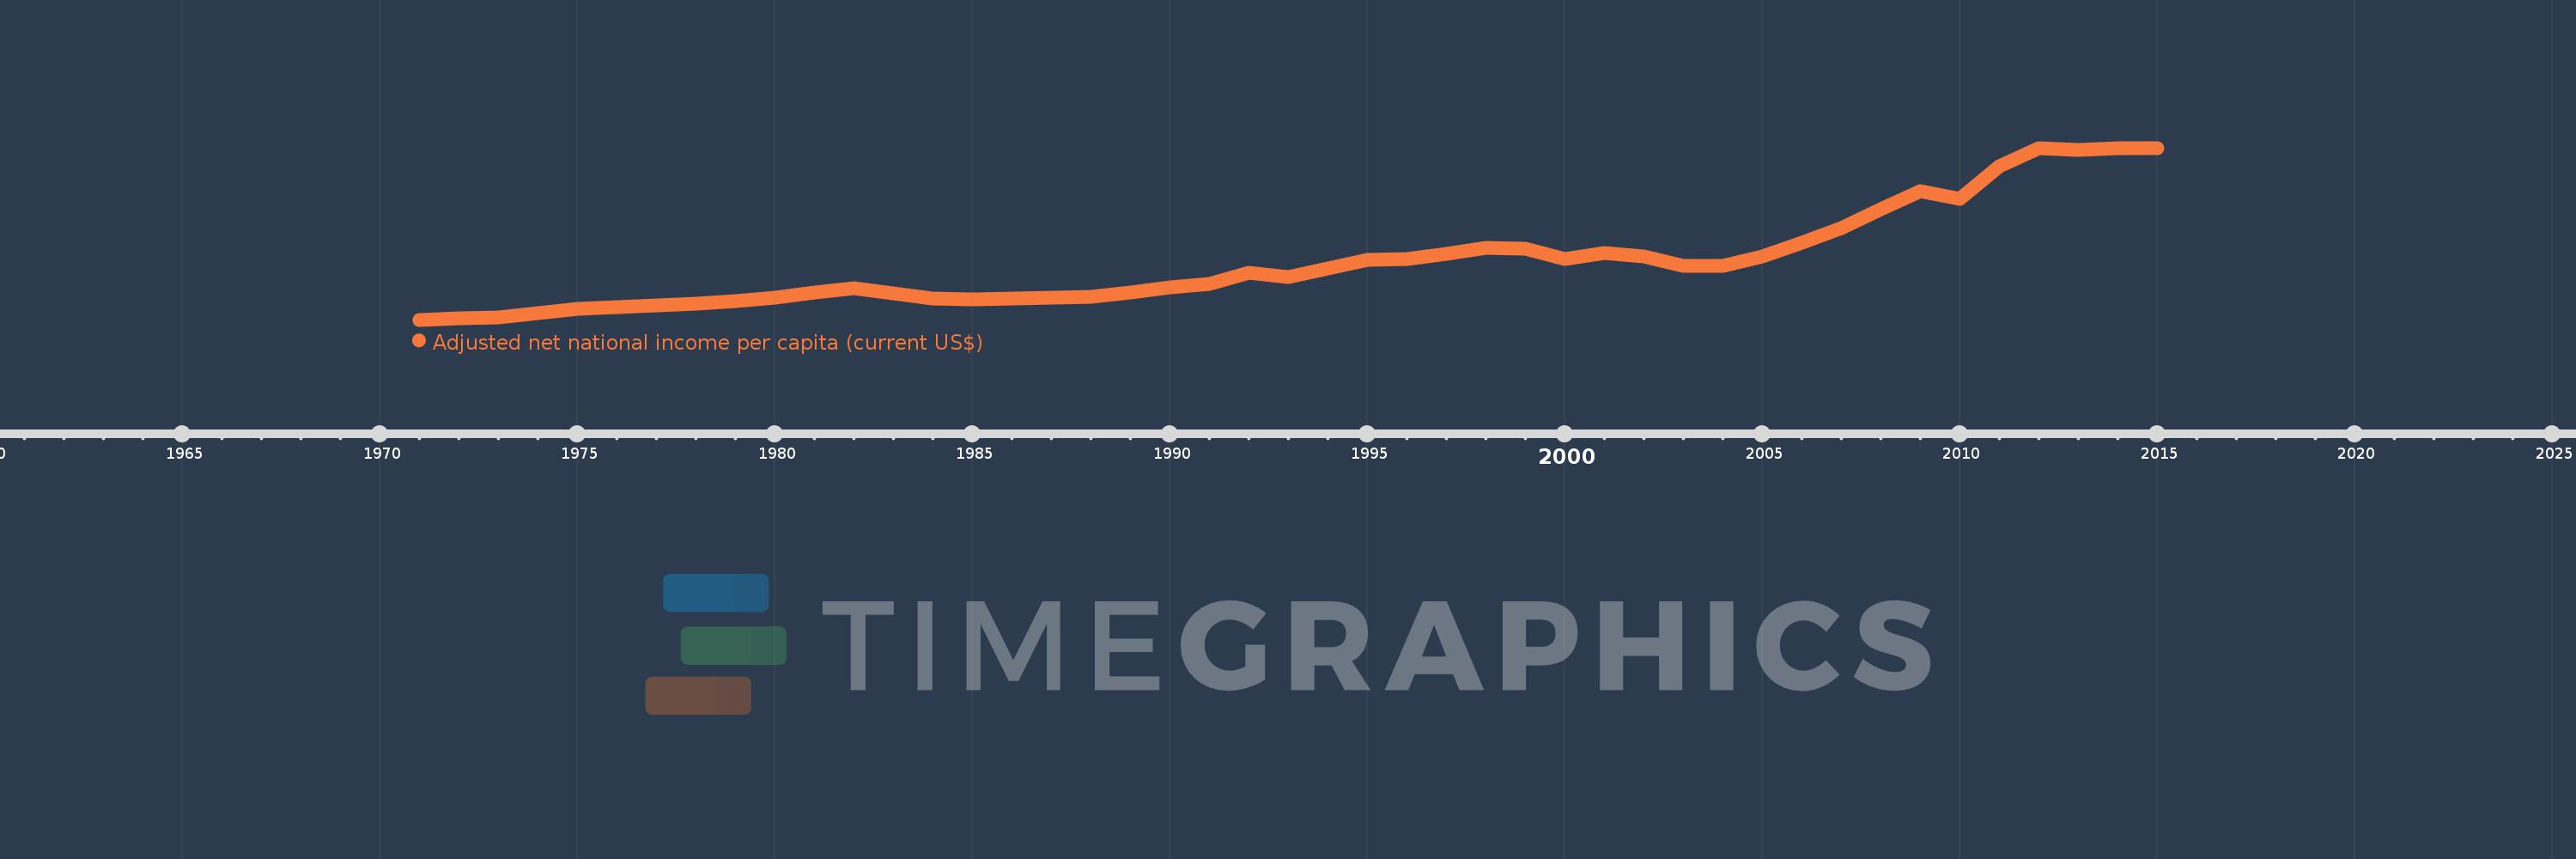
Adjusted net national income per capita (current US$)
2015,2014,2013,2012,2011,2010,2009,2008,2007,2006,2005,2004,2003,2002,2001,2000,1999,1998,1997,1996,1995,1994,1993,1992,1991,1990,1989,1988,1987,1986,1985,1984,1983,1982,1981,1980,1979,1978,1977,1976,1975,1974,1973,1972,1971
Estas estadísticas en otros países:
AfghanistanAlbaniaAlgeriaAngolaArab WorldArgentinaArmeniaAustraliaAustriaAzerbaijanBahamas, TheBahrainBangladeshBarbadosBelarusBelgiumBelizeBeninBhutanBoliviaBotswanaBrazilBrunei DarussalamBulgariaBurkina FasoBurundiCabo VerdeCambodiaCameroonCanadaCaribbean small statesCentral African RepublicCentral Europe and the BalticsChadChileChinaColombiaComorosCongo, Dem. Rep.Congo, Rep.Costa RicaCote d'IvoireCroatiaCubaCyprusCzech RepublicDenmarkDjiboutiDominicaDominican RepublicEarly-demographic dividendEast Asia & PacificEast Asia & Pacific (excluding high income)East Asia & Pacific (IDA & IBRD countries)EcuadorEgypt, Arab Rep.El SalvadorEquatorial GuineaEritreaEstoniaEthiopiaEuro areaEurope & Central AsiaEurope & Central Asia (excluding high income)Europe & Central Asia (IDA & IBRD countries)European UnionFijiFinlandFragile and conflict affected situationsFranceGabonGambia, TheGeorgiaGermanyGhanaGreeceGuatemalaGuineaGuinea-BissauGuyanaHaitiHeavily indebted poor countries (HIPC)High incomeHondurasHong Kong SAR, ChinaHungaryIBRD onlyIcelandIDA & IBRD totalIDA blendIDA onlyIDA totalIndiaIndonesiaIran, Islamic Rep.IraqIrelandIsraelItalyJamaicaJapanJordanKazakhstanKenyaKiribatiKorea, Rep.KuwaitKyrgyz RepublicLao PDRLate-demographic dividendLatin America & Caribbean Latin America & Caribbean (excluding high income)Latin America & the Caribbean (IDA & IBRD countries)LatviaLeast developed countries: UN classificationLebanonLesothoLiberiaLibyaLithuaniaLow & middle incomeLow incomeLower middle incomeLuxembourgMacedonia, FYRMadagascarMalawiMalaysiaMaldivesMaliMauritaniaMauritiusMexicoMiddle East & North AfricaMiddle East & North Africa (excluding high income)Middle East & North Africa (IDA & IBRD countries)Middle incomeMoldovaMongoliaMoroccoMozambiqueMyanmarNamibiaNepalNetherlandsNew ZealandNicaraguaNigerNigeriaNorth AmericaNorwayOECD membersOmanOther small statesPacific island small statesPakistanPanamaPapua New GuineaParaguayPeruPhilippinesPolandPortugalPost-demographic dividendPre-demographic dividendQatarRomaniaRussian FederationRwandaSamoaSao Tome and PrincipeSaudi ArabiaSenegalSeychellesSierra LeoneSingaporeSlovak RepublicSloveniaSmall statesSolomon IslandsSouth AfricaSouth AsiaSouth Asia (IDA & IBRD)SpainSri LankaSt. LuciaSt. Vincent and the GrenadinesSub-Saharan Africa Sub-Saharan Africa (excluding high income)Sub-Saharan Africa (IDA & IBRD countries)SudanSurinameSwazilandSwedenSwitzerlandSyrian Arab RepublicTajikistanTanzaniaThailandTogoTongaTrinidad and TobagoTunisiaTurkeyTurkmenistanUgandaUkraineUnited Arab EmiratesUnited KingdomUnited StatesUpper middle incomeUruguayUzbekistanVanuatuVenezuela, RBVietnamWorldYemen, Rep.ZambiaZimbabwe línea de tiempo (timeline):
En esta escala de tiempo se presenta un gráfico de 1971 y 2015 de Latin America & Caribbean (excluding high income). Los datos de 1970 están ausentes. El número de observaciones reales por fecha: 45.
Fuente (nombre):
Indicadores del desarrollo mundial
Fuente (organización):
World Bank staff estimates based on sources and methods in World Bank's "The Changing Wealth of Nations: Measuring Sustainable Development in the New Millennium" (2011).
Categorías:
Economy & Growth
Se ha actualizado:
23 abr 2017 año
Los indicadores de los cambios de valor en los últimos años
Mínimo:
507.264
1 ene 1971 año
Máximo:
8.019 mil
1 ene 2014 año
A la fecha de observación
Valor
Cambio absoluto
El cambio con respecto al valor anterior
1 ene 1971 año
507.264
+507.264
0.0%
1 ene 1972 año
554.359
+47.095
9.28%
1 ene 1973 año
612.78
+58.422
10.54%
1 ene 1974 año
781.55
+168.77
27.54%
1 ene 1975 año
989.583
+208.034
26.62%
1 ene 1976 año
1.051 mil
+61.741
6.24%
1 ene 1977 año
1.13 mil
+78.187
7.44%
1 ene 1978 año
1.202 mil
+72.065
6.38%
1 ene 1979 año
1.324 mil
+122.603
10.2%
1 ene 1980 año
1.465 mil
+141.148
10.66%
1 ene 1981 año
1.682 mil
+217.073
14.81%
1 ene 1982 año
1.889 mil
+206.455
12.27%
1 ene 1983 año
1.678 mil
-210.629
-11.15%
1 ene 1984 año
1.438 mil
-240.596
-14.34%
1 ene 1985 año
1.395 mil
-42.982
-2.99%
1 ene 1986 año
1.432 mil
+37.1
2.66%
1 ene 1987 año
1.477 mil
+45.468
3.18%
1 ene 1988 año
1.513 mil
+36.0
2.44%
1 ene 1989 año
1.704 mil
+190.465
12.59%
1 ene 1990 año
1.919 mil
+215.764
12.66%
1 ene 1991 año
2.067 mil
+147.774
7.7%
1 ene 1992 año
2.579 mil
+511.844
24.76%
1 ene 1993 año
2.384 mil
-195.33
-7.57%
1 ene 1994 año
2.75 mil
+366.076
15.36%
1 ene 1995 año
3.107 mil
+357.591
13.0%
1 ene 1996 año
3.179 mil
+71.175
2.29%
1 ene 1997 año
3.379 mil
+200.772
6.32%
1 ene 1998 año
3.657 mil
+277.498
8.21%
1 ene 1999 año
3.606 mil
-50.621
-1.38%
1 ene 2000 año
3.147 mil
-459.067
-12.73%
1 ene 2001 año
3.416 mil
+269.098
8.55%
1 ene 2002 año
3.289 mil
-126.81
-3.71%
1 ene 2003 año
2.87 mil
-419.425
-12.75%
1 ene 2004 año
2.87 mil
-0.237
-0.01%
1 ene 2005 año
3.283 mil
+413.406
14.41%
1 ene 2006 año
3.893 mil
+610.209
18.59%
1 ene 2007 año
4.517 mil
+623.403
16.01%
1 ene 2008 año
5.347 mil
+829.924
18.37%
1 ene 2009 año
6.129 mil
+781.918
14.62%
1 ene 2010 año
5.809 mil
-319.844
-5.22%
1 ene 2011 año
7.231 mil
+1.422 mil
24.49%
1 ene 2012 año
7.991 mil
+759.974
10.51%
1 ene 2013 año
7.939 mil
-52.491
-0.66%
1 ene 2014 año
8.019 mil
+79.987
1.01%
1 ene 2015 año
7.991 mil
-28.023
-0.35%
Ranking de los países por los datos estadísticos actuales


Comentarios: