29
/es/
es
AIzaSyAYiBZKx7MnpbEhh9jyipgxe19OcubqV5w
April 1, 2024
110533
Congo, Rep.
COG
true
2
1
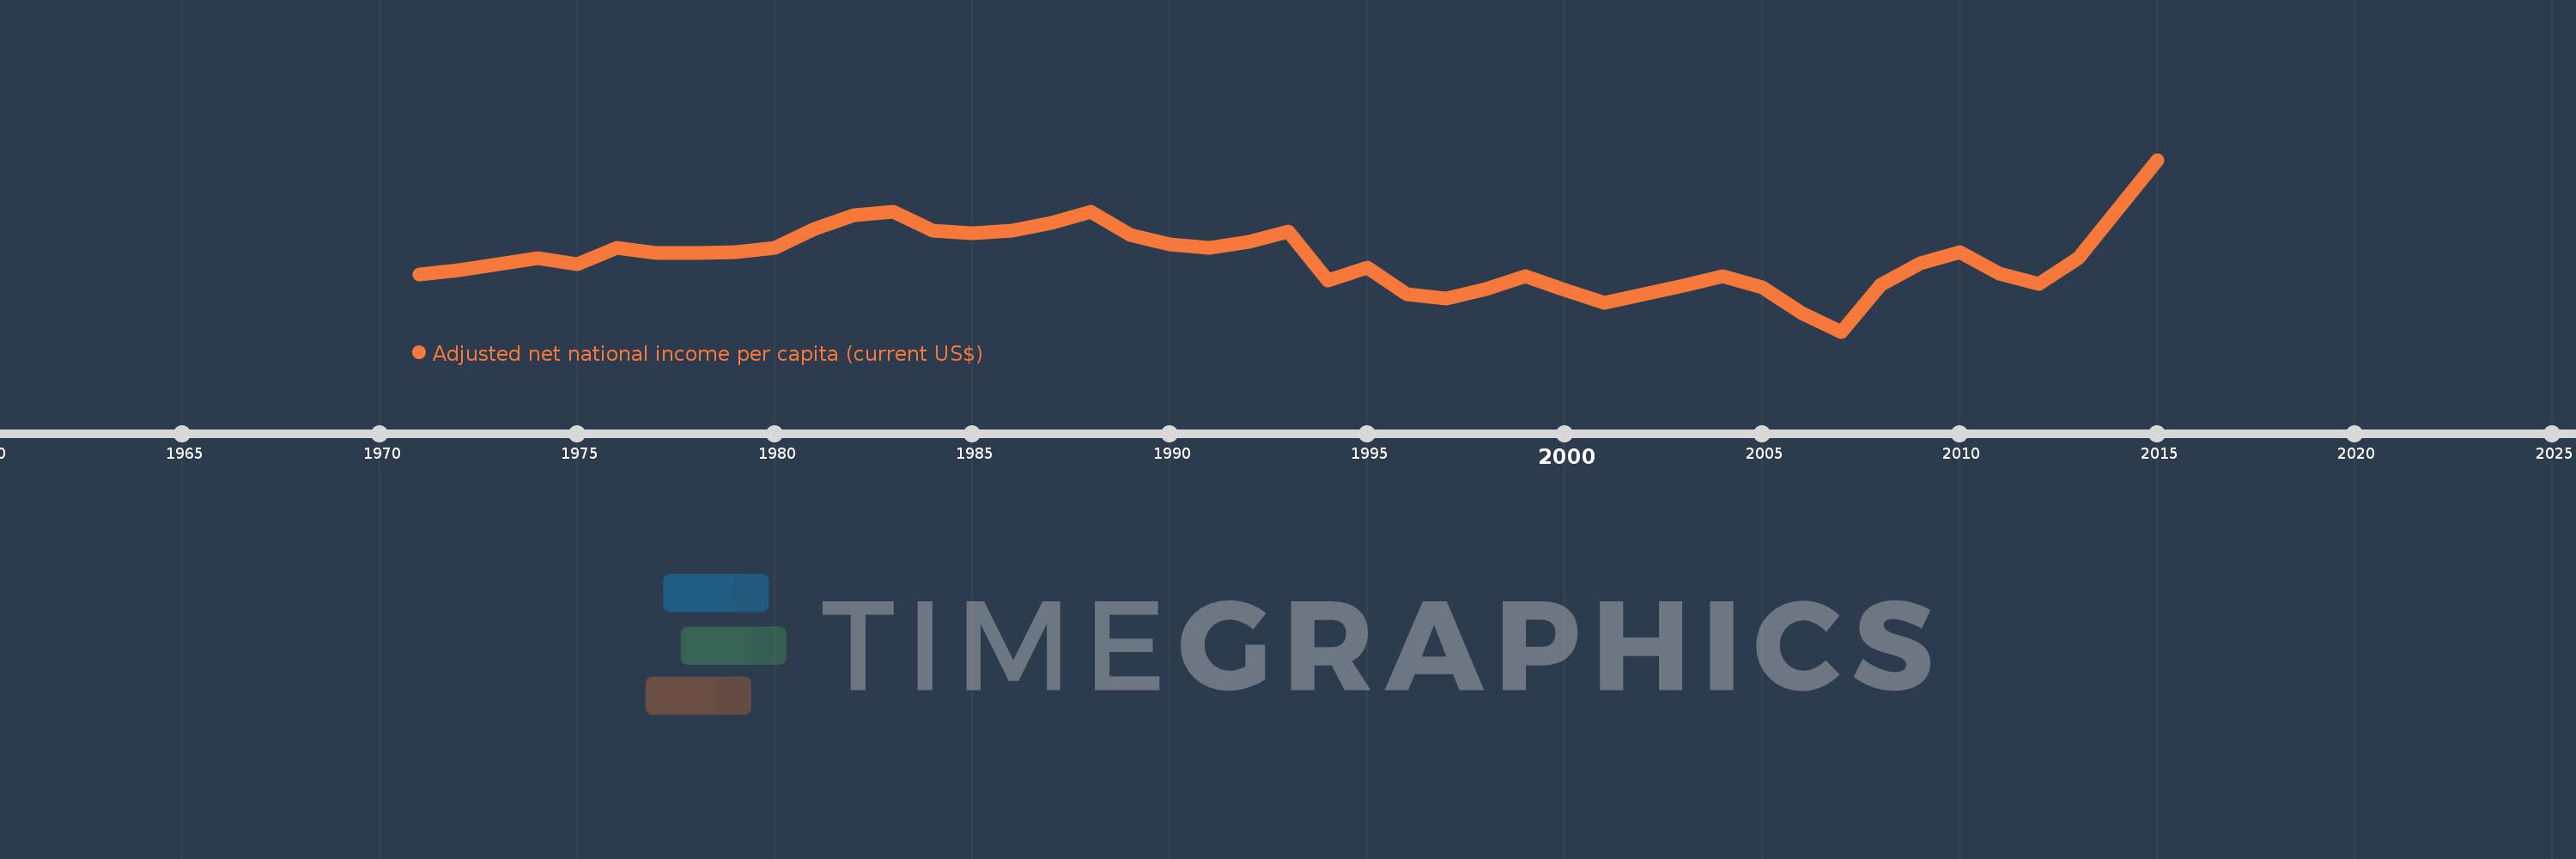
Adjusted net national income per capita (current US$)
2015,2014,2013,2012,2011,2010,2009,2008,2007,2006,2005,2004,2003,2002,2001,2000,1999,1998,1997,1996,1995,1994,1993,1992,1991,1990,1989,1988,1987,1986,1985,1984,1983,1982,1981,1980,1979,1978,1977,1976,1975,1974,1973,1972,1971
Estas estadísticas en otros países:
AfghanistanAlbaniaAlgeriaAngolaArab WorldArgentinaArmeniaAustraliaAustriaAzerbaijanBahamas, TheBahrainBangladeshBarbadosBelarusBelgiumBelizeBeninBhutanBoliviaBotswanaBrazilBrunei DarussalamBulgariaBurkina FasoBurundiCabo VerdeCambodiaCameroonCanadaCaribbean small statesCentral African RepublicCentral Europe and the BalticsChadChileChinaColombiaComorosCongo, Dem. Rep.Congo, Rep.Costa RicaCote d'IvoireCroatiaCubaCyprusCzech RepublicDenmarkDjiboutiDominicaDominican RepublicEarly-demographic dividendEast Asia & PacificEast Asia & Pacific (excluding high income)East Asia & Pacific (IDA & IBRD countries)EcuadorEgypt, Arab Rep.El SalvadorEquatorial GuineaEritreaEstoniaEthiopiaEuro areaEurope & Central AsiaEurope & Central Asia (excluding high income)Europe & Central Asia (IDA & IBRD countries)European UnionFijiFinlandFragile and conflict affected situationsFranceGabonGambia, TheGeorgiaGermanyGhanaGreeceGuatemalaGuineaGuinea-BissauGuyanaHaitiHeavily indebted poor countries (HIPC)High incomeHondurasHong Kong SAR, ChinaHungaryIBRD onlyIcelandIDA & IBRD totalIDA blendIDA onlyIDA totalIndiaIndonesiaIran, Islamic Rep.IraqIrelandIsraelItalyJamaicaJapanJordanKazakhstanKenyaKiribatiKorea, Rep.KuwaitKyrgyz RepublicLao PDRLate-demographic dividendLatin America & Caribbean Latin America & Caribbean (excluding high income)Latin America & the Caribbean (IDA & IBRD countries)LatviaLeast developed countries: UN classificationLebanonLesothoLiberiaLibyaLithuaniaLow & middle incomeLow incomeLower middle incomeLuxembourgMacedonia, FYRMadagascarMalawiMalaysiaMaldivesMaliMauritaniaMauritiusMexicoMiddle East & North AfricaMiddle East & North Africa (excluding high income)Middle East & North Africa (IDA & IBRD countries)Middle incomeMoldovaMongoliaMoroccoMozambiqueMyanmarNamibiaNepalNetherlandsNew ZealandNicaraguaNigerNigeriaNorth AmericaNorwayOECD membersOmanOther small statesPacific island small statesPakistanPanamaPapua New GuineaParaguayPeruPhilippinesPolandPortugalPost-demographic dividendPre-demographic dividendQatarRomaniaRussian FederationRwandaSamoaSao Tome and PrincipeSaudi ArabiaSenegalSeychellesSierra LeoneSingaporeSlovak RepublicSloveniaSmall statesSolomon IslandsSouth AfricaSouth AsiaSouth Asia (IDA & IBRD)SpainSri LankaSt. LuciaSt. Vincent and the GrenadinesSub-Saharan Africa Sub-Saharan Africa (excluding high income)Sub-Saharan Africa (IDA & IBRD countries)SudanSurinameSwazilandSwedenSwitzerlandSyrian Arab RepublicTajikistanTanzaniaThailandTogoTongaTrinidad and TobagoTunisiaTurkeyTurkmenistanUgandaUkraineUnited Arab EmiratesUnited KingdomUnited StatesUpper middle incomeUruguayUzbekistanVanuatuVenezuela, RBVietnamWorldYemen, Rep.ZambiaZimbabwe línea de tiempo (timeline):
En esta escala de tiempo se presenta un gráfico de 1971 y 2015 de Congo, Rep.. Los datos de 1970 están ausentes. El número de observaciones reales por fecha: 45.
Fuente (nombre):
Indicadores del desarrollo mundial
Fuente (organización):
World Bank staff estimates based on sources and methods in World Bank's "The Changing Wealth of Nations: Measuring Sustainable Development in the New Millennium" (2011).
Categorías:
Economy & Growth
Se ha actualizado:
23 abr 2017 año
Los indicadores de los cambios de valor en los últimos años
Mínimo:
-190.081
1 ene 2007 año
Máximo:
914.505
1 ene 2015 año
A la fecha de observación
Valor
Cambio absoluto
El cambio con respecto al valor anterior
1 ene 1971 año
179.57
+179.57
0.0%
1 ene 1972 año
202.839
+23.269
12.96%
1 ene 1973 año
242.918
+40.08
19.76%
1 ene 1974 año
282.796
+39.878
16.42%
1 ene 1975 año
242.499
-40.297
-14.25%
1 ene 1976 año
348.012
+105.513
43.51%
1 ene 1977 año
314.264
-33.748
-9.7%
1 ene 1978 año
317.365
+3.101
0.99%
1 ene 1979 año
322.964
+5.599
1.76%
1 ene 1980 año
349.081
+26.117
8.09%
1 ene 1981 año
469.003
+119.922
34.35%
1 ene 1982 año
560.883
+91.88
19.59%
1 ene 1983 año
579.885
+19.002
3.39%
1 ene 1984 año
458.651
-121.235
-20.91%
1 ene 1985 año
440.699
-17.951
-3.91%
1 ene 1986 año
457.872
+17.173
3.9%
1 ene 1987 año
511.282
+53.41
11.66%
1 ene 1988 año
582.346
+71.064
13.9%
1 ene 1989 año
433.691
-148.655
-25.53%
1 ene 1990 año
370.434
-63.256
-14.59%
1 ene 1991 año
349.384
-21.05
-5.68%
1 ene 1992 año
385.192
+35.808
10.25%
1 ene 1993 año
453.781
+68.589
17.81%
1 ene 1994 año
136.542
-317.239
-69.91%
1 ene 1995 año
221.796
+85.254
62.44%
1 ene 1996 año
50.838
-170.958
-77.08%
1 ene 1997 año
21.865
-28.973
-56.99%
1 ene 1998 año
81.659
+59.794
273.47%
1 ene 1999 año
165.703
+84.044
102.92%
1 ene 2000 año
79.835
-85.868
-51.82%
1 ene 2001 año
-7.262
-87.097
-109.1%
1 ene 2002 año
51.351
+58.613
-807.11%
1 ene 2003 año
103.053
+51.702
100.68%
1 ene 2004 año
164.869
+61.816
59.98%
1 ene 2005 año
95.437
-69.432
-42.11%
1 ene 2006 año
-68.983
-164.42
-172.28%
1 ene 2007 año
-190.081
-121.097
175.55%
1 ene 2008 año
112.487
+302.568
-159.18%
1 ene 2009 año
247.034
+134.547
119.61%
1 ene 2010 año
321.278
+74.244
30.05%
1 ene 2011 año
181.346
-139.932
-43.55%
1 ene 2012 año
117.097
-64.248
-35.43%
1 ene 2013 año
283.695
+166.598
142.27%
1 ene 2014 año
598.554
+314.858
110.98%
1 ene 2015 año
914.505
+315.951
52.79%
Ranking de los países por los datos estadísticos actuales


Comentarios: