29
/es/
es
AIzaSyAYiBZKx7MnpbEhh9jyipgxe19OcubqV5w
April 1, 2024
115537
Cuba
CUB
true
2
1
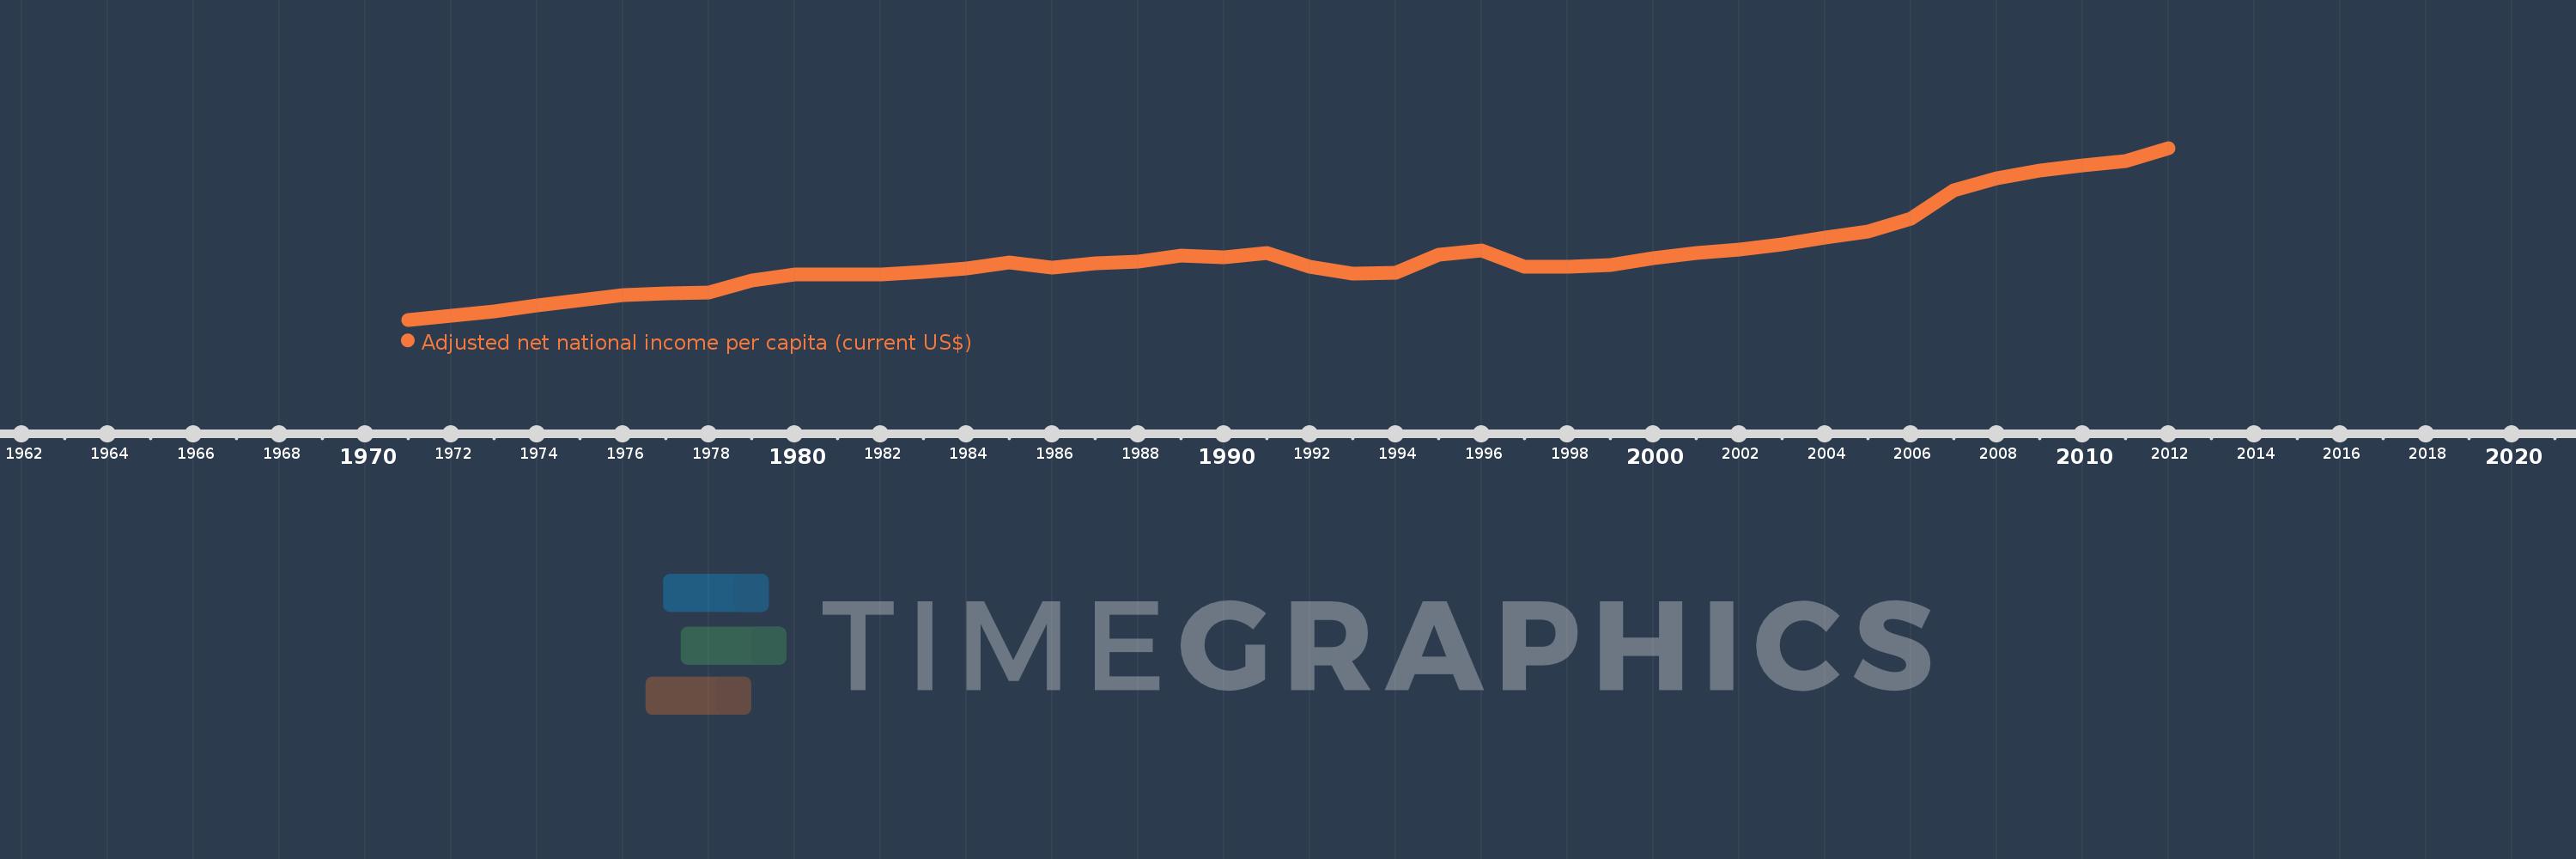
Adjusted net national income per capita (current US$)
2012,2011,2010,2009,2008,2007,2006,2005,2004,2003,2002,2001,2000,1999,1998,1997,1996,1995,1994,1993,1992,1991,1990,1989,1988,1987,1986,1985,1984,1983,1982,1981,1980,1979,1978,1977,1976,1975,1974,1973,1972,1971
Estas estadísticas en otros países:
AfghanistanAlbaniaAlgeriaAngolaArab WorldArgentinaArmeniaAustraliaAustriaAzerbaijanBahamas, TheBahrainBangladeshBarbadosBelarusBelgiumBelizeBeninBhutanBoliviaBotswanaBrazilBrunei DarussalamBulgariaBurkina FasoBurundiCabo VerdeCambodiaCameroonCanadaCaribbean small statesCentral African RepublicCentral Europe and the BalticsChadChileChinaColombiaComorosCongo, Dem. Rep.Congo, Rep.Costa RicaCote d'IvoireCroatiaCubaCyprusCzech RepublicDenmarkDjiboutiDominicaDominican RepublicEarly-demographic dividendEast Asia & PacificEast Asia & Pacific (excluding high income)East Asia & Pacific (IDA & IBRD countries)EcuadorEgypt, Arab Rep.El SalvadorEquatorial GuineaEritreaEstoniaEthiopiaEuro areaEurope & Central AsiaEurope & Central Asia (excluding high income)Europe & Central Asia (IDA & IBRD countries)European UnionFijiFinlandFragile and conflict affected situationsFranceGabonGambia, TheGeorgiaGermanyGhanaGreeceGuatemalaGuineaGuinea-BissauGuyanaHaitiHeavily indebted poor countries (HIPC)High incomeHondurasHong Kong SAR, ChinaHungaryIBRD onlyIcelandIDA & IBRD totalIDA blendIDA onlyIDA totalIndiaIndonesiaIran, Islamic Rep.IraqIrelandIsraelItalyJamaicaJapanJordanKazakhstanKenyaKiribatiKorea, Rep.KuwaitKyrgyz RepublicLao PDRLate-demographic dividendLatin America & Caribbean Latin America & Caribbean (excluding high income)Latin America & the Caribbean (IDA & IBRD countries)LatviaLeast developed countries: UN classificationLebanonLesothoLiberiaLibyaLithuaniaLow & middle incomeLow incomeLower middle incomeLuxembourgMacedonia, FYRMadagascarMalawiMalaysiaMaldivesMaliMauritaniaMauritiusMexicoMiddle East & North AfricaMiddle East & North Africa (excluding high income)Middle East & North Africa (IDA & IBRD countries)Middle incomeMoldovaMongoliaMoroccoMozambiqueMyanmarNamibiaNepalNetherlandsNew ZealandNicaraguaNigerNigeriaNorth AmericaNorwayOECD membersOmanOther small statesPacific island small statesPakistanPanamaPapua New GuineaParaguayPeruPhilippinesPolandPortugalPost-demographic dividendPre-demographic dividendQatarRomaniaRussian FederationRwandaSamoaSao Tome and PrincipeSaudi ArabiaSenegalSeychellesSierra LeoneSingaporeSlovak RepublicSloveniaSmall statesSolomon IslandsSouth AfricaSouth AsiaSouth Asia (IDA & IBRD)SpainSri LankaSt. LuciaSt. Vincent and the GrenadinesSub-Saharan Africa Sub-Saharan Africa (excluding high income)Sub-Saharan Africa (IDA & IBRD countries)SudanSurinameSwazilandSwedenSwitzerlandSyrian Arab RepublicTajikistanTanzaniaThailandTogoTongaTrinidad and TobagoTunisiaTurkeyTurkmenistanUgandaUkraineUnited Arab EmiratesUnited KingdomUnited StatesUpper middle incomeUruguayUzbekistanVanuatuVenezuela, RBVietnamWorldYemen, Rep.ZambiaZimbabwe línea de tiempo (timeline):
En esta escala de tiempo se presenta un gráfico de 1971 y 2012 de Cuba. Los datos de 1970 están ausentes. El número de observaciones reales por fecha: 42.
Fuente (nombre):
Indicadores del desarrollo mundial
Fuente (organización):
World Bank staff estimates based on sources and methods in World Bank's "The Changing Wealth of Nations: Measuring Sustainable Development in the New Millennium" (2011).
Categorías:
Economy & Growth
Se ha actualizado:
23 abr 2017 año
Los indicadores de los cambios de valor en los últimos años
Mínimo:
601.564
1 ene 1971 año
Máximo:
5.297 mil
1 ene 2012 año
A la fecha de observación
Valor
Cambio absoluto
El cambio con respecto al valor anterior
1 ene 1971 año
601.564
+601.564
0.0%
1 ene 1972 año
717.794
+116.23
19.32%
1 ene 1973 año
830.038
+112.244
15.64%
1 ene 1974 año
1.002 mil
+172.287
20.76%
1 ene 1975 año
1.128 mil
+125.369
12.51%
1 ene 1976 año
1.264 mil
+136.48
12.1%
1 ene 1977 año
1.322 mil
+58.128
4.6%
1 ene 1978 año
1.349 mil
+26.295
1.99%
1 ene 1979 año
1.682 mil
+333.45
24.73%
1 ene 1980 año
1.829 mil
+147.283
8.76%
1 ene 1981 año
1.833 mil
+3.345
0.18%
1 ene 1982 año
1.843 mil
+10.161
0.55%
1 ene 1983 año
1.901 mil
+57.9
3.14%
1 ene 1984 año
2.009 mil
+108.235
5.69%
1 ene 1985 año
2.165 mil
+156.205
7.78%
1 ene 1986 año
2.031 mil
-134.329
-6.2%
1 ene 1987 año
2.136 mil
+104.895
5.17%
1 ene 1988 año
2.201 mil
+65.373
3.06%
1 ene 1989 año
2.366 mil
+165.306
7.51%
1 ene 1990 año
2.309 mil
-57.214
-2.42%
1 ene 1991 año
2.42 mil
+111.081
4.81%
1 ene 1992 año
2.053 mil
-367.571
-15.19%
1 ene 1993 año
1.865 mil
-187.846
-9.15%
1 ene 1994 año
1.885 mil
+20.315
1.09%
1 ene 1995 año
2.378 mil
+493.138
26.16%
1 ene 1996 año
2.496 mil
+117.962
4.96%
1 ene 1997 año
2.039 mil
-457.431
-18.32%
1 ene 1998 año
2.059 mil
+20.62
1.01%
1 ene 1999 año
2.087 mil
+27.828
1.35%
1 ene 2000 año
2.286 mil
+198.291
9.5%
1 ene 2001 año
2.415 mil
+128.945
5.64%
1 ene 2002 año
2.523 mil
+108.379
4.49%
1 ene 2003 año
2.665 mil
+141.703
5.62%
1 ene 2004 año
2.845 mil
+180.508
6.77%
1 ene 2005 año
3.007 mil
+161.419
5.67%
1 ene 2006 año
3.359 mil
+352.067
11.71%
1 ene 2007 año
4.142 mil
+783.501
23.33%
1 ene 2008 año
4.468 mil
+326.201
7.88%
1 ene 2009 año
4.675 mil
+206.293
4.62%
1 ene 2010 año
4.81 mil
+135.146
2.89%
1 ene 2011 año
4.934 mil
+124.088
2.58%
1 ene 2012 año
5.297 mil
+363.332
7.36%
Ranking de los países por los datos estadísticos actuales


Comentarios: