29
/es/
es
AIzaSyAYiBZKx7MnpbEhh9jyipgxe19OcubqV5w
April 1, 2024
135152
Gabon
GAB
true
2
1
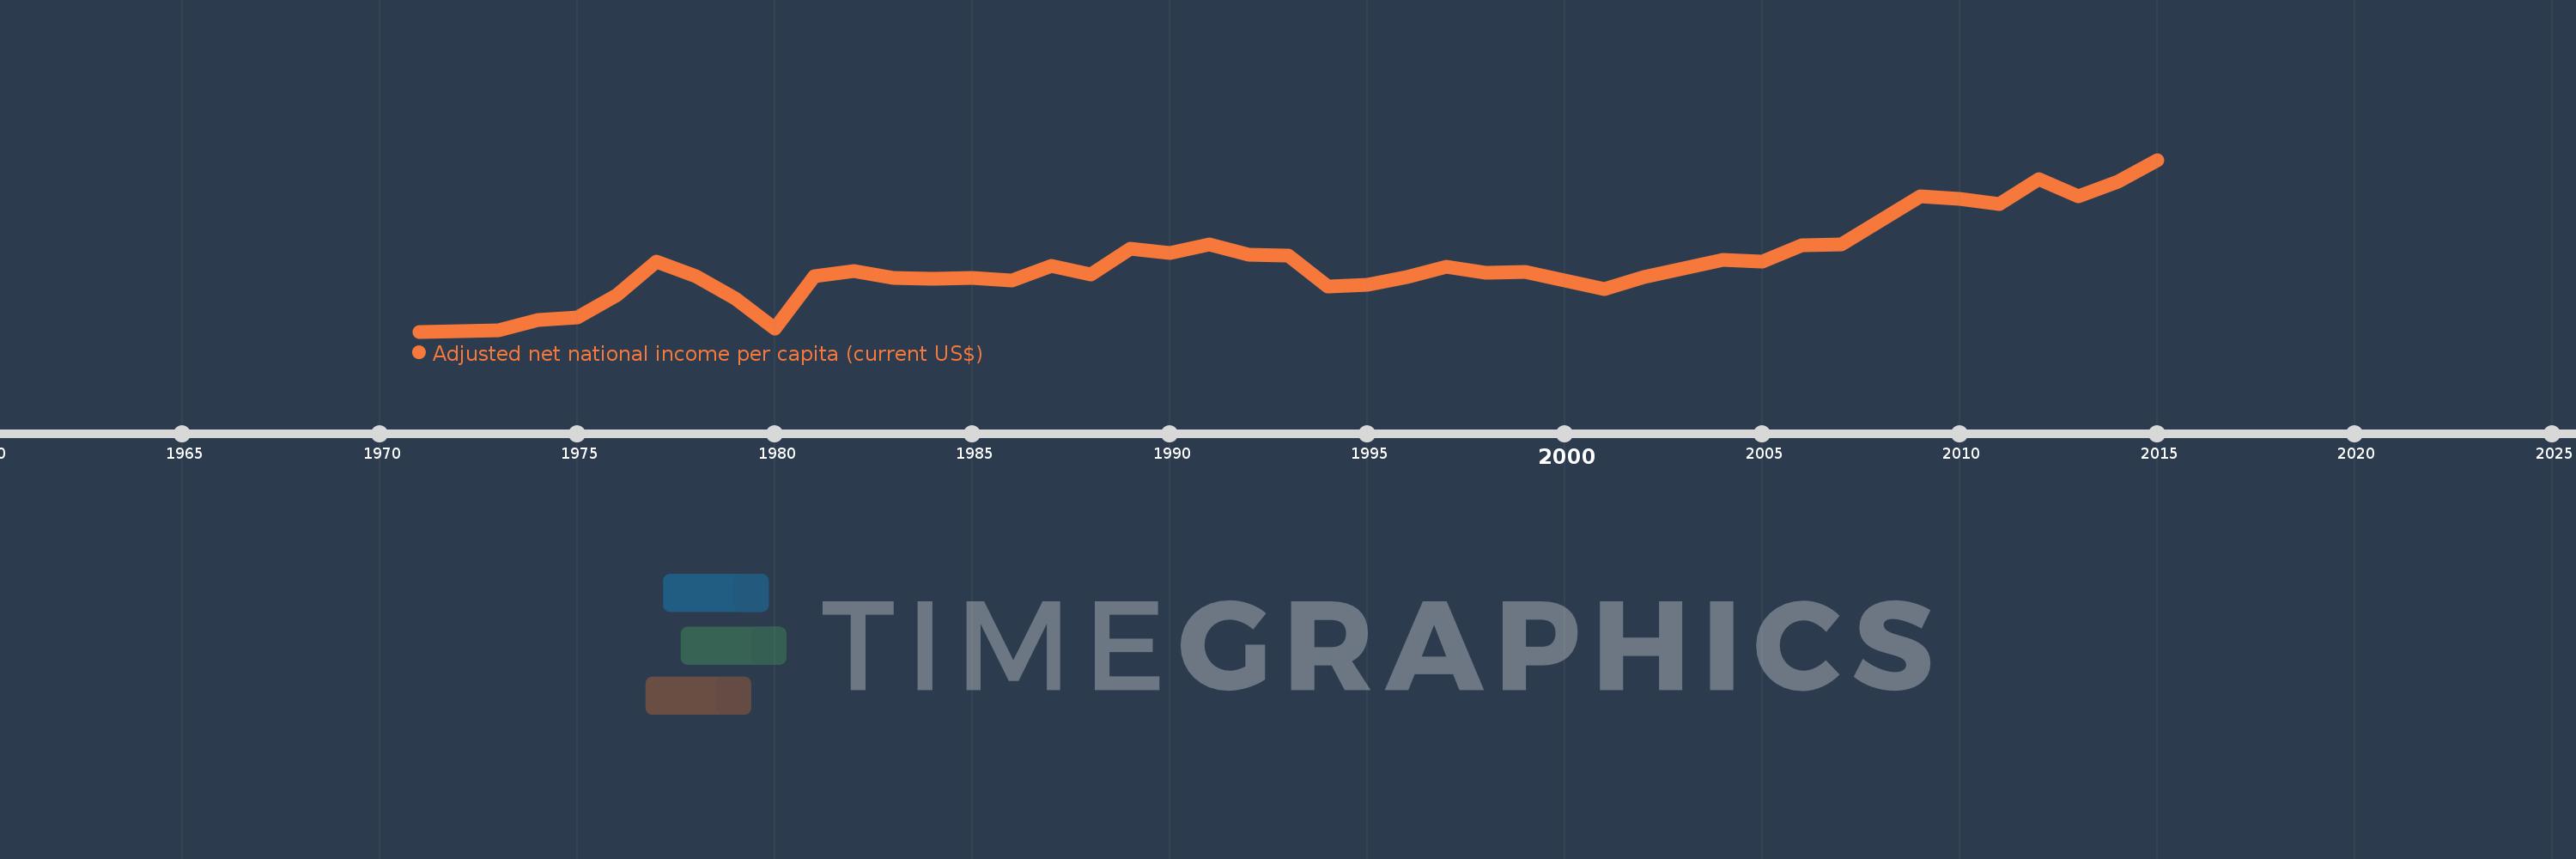
Adjusted net national income per capita (current US$)
2015,2014,2013,2012,2011,2010,2009,2008,2007,2006,2005,2004,2003,2002,2001,2000,1999,1998,1997,1996,1995,1994,1993,1992,1991,1990,1989,1988,1987,1986,1985,1984,1983,1982,1981,1980,1979,1978,1977,1976,1975,1974,1973,1972,1971
Estas estadísticas en otros países:
AfghanistanAlbaniaAlgeriaAngolaArab WorldArgentinaArmeniaAustraliaAustriaAzerbaijanBahamas, TheBahrainBangladeshBarbadosBelarusBelgiumBelizeBeninBhutanBoliviaBotswanaBrazilBrunei DarussalamBulgariaBurkina FasoBurundiCabo VerdeCambodiaCameroonCanadaCaribbean small statesCentral African RepublicCentral Europe and the BalticsChadChileChinaColombiaComorosCongo, Dem. Rep.Congo, Rep.Costa RicaCote d'IvoireCroatiaCubaCyprusCzech RepublicDenmarkDjiboutiDominicaDominican RepublicEarly-demographic dividendEast Asia & PacificEast Asia & Pacific (excluding high income)East Asia & Pacific (IDA & IBRD countries)EcuadorEgypt, Arab Rep.El SalvadorEquatorial GuineaEritreaEstoniaEthiopiaEuro areaEurope & Central AsiaEurope & Central Asia (excluding high income)Europe & Central Asia (IDA & IBRD countries)European UnionFijiFinlandFragile and conflict affected situationsFranceGabonGambia, TheGeorgiaGermanyGhanaGreeceGuatemalaGuineaGuinea-BissauGuyanaHaitiHeavily indebted poor countries (HIPC)High incomeHondurasHong Kong SAR, ChinaHungaryIBRD onlyIcelandIDA & IBRD totalIDA blendIDA onlyIDA totalIndiaIndonesiaIran, Islamic Rep.IraqIrelandIsraelItalyJamaicaJapanJordanKazakhstanKenyaKiribatiKorea, Rep.KuwaitKyrgyz RepublicLao PDRLate-demographic dividendLatin America & Caribbean Latin America & Caribbean (excluding high income)Latin America & the Caribbean (IDA & IBRD countries)LatviaLeast developed countries: UN classificationLebanonLesothoLiberiaLibyaLithuaniaLow & middle incomeLow incomeLower middle incomeLuxembourgMacedonia, FYRMadagascarMalawiMalaysiaMaldivesMaliMauritaniaMauritiusMexicoMiddle East & North AfricaMiddle East & North Africa (excluding high income)Middle East & North Africa (IDA & IBRD countries)Middle incomeMoldovaMongoliaMoroccoMozambiqueMyanmarNamibiaNepalNetherlandsNew ZealandNicaraguaNigerNigeriaNorth AmericaNorwayOECD membersOmanOther small statesPacific island small statesPakistanPanamaPapua New GuineaParaguayPeruPhilippinesPolandPortugalPost-demographic dividendPre-demographic dividendQatarRomaniaRussian FederationRwandaSamoaSao Tome and PrincipeSaudi ArabiaSenegalSeychellesSierra LeoneSingaporeSlovak RepublicSloveniaSmall statesSolomon IslandsSouth AfricaSouth AsiaSouth Asia (IDA & IBRD)SpainSri LankaSt. LuciaSt. Vincent and the GrenadinesSub-Saharan Africa Sub-Saharan Africa (excluding high income)Sub-Saharan Africa (IDA & IBRD countries)SudanSurinameSwazilandSwedenSwitzerlandSyrian Arab RepublicTajikistanTanzaniaThailandTogoTongaTrinidad and TobagoTunisiaTurkeyTurkmenistanUgandaUkraineUnited Arab EmiratesUnited KingdomUnited StatesUpper middle incomeUruguayUzbekistanVanuatuVenezuela, RBVietnamWorldYemen, Rep.ZambiaZimbabwe línea de tiempo (timeline):
En esta escala de tiempo se presenta un gráfico de 1971 y 2015 de Gabon. Los datos de 1970 están ausentes. El número de observaciones reales por fecha: 45.
Fuente (nombre):
Indicadores del desarrollo mundial
Fuente (organización):
World Bank staff estimates based on sources and methods in World Bank's "The Changing Wealth of Nations: Measuring Sustainable Development in the New Millennium" (2011).
Categorías:
Economy & Growth
Se ha actualizado:
23 abr 2017 año
Los indicadores de los cambios de valor en los últimos años
Mínimo:
341.278
1 ene 1971 año
Máximo:
5.45 mil
1 ene 2015 año
A la fecha de observación
Valor
Cambio absoluto
El cambio con respecto al valor anterior
1 ene 1971 año
341.278
+341.278
0.0%
1 ene 1972 año
362.354
+21.075
6.18%
1 ene 1973 año
391.929
+29.576
8.16%
1 ene 1974 año
687.61
+295.681
75.44%
1 ene 1975 año
755.6
+67.989
9.89%
1 ene 1976 año
1.425 mil
+669.74
88.64%
1 ene 1977 año
2.417 mil
+991.227
69.54%
1 ene 1978 año
1.993 mil
-423.345
-17.52%
1 ene 1979 año
1.314 mil
-679.42
-34.09%
1 ene 1980 año
437.153
-876.649
-66.73%
1 ene 1981 año
1.999 mil
+1.562 mil
357.33%
1 ene 1982 año
2.133 mil
+133.946
6.7%
1 ene 1983 año
1.942 mil
-190.739
-8.94%
1 ene 1984 año
1.918 mil
-24.33
-1.25%
1 ene 1985 año
1.945 mil
+27.198
1.42%
1 ene 1986 año
1.857 mil
-87.952
-4.52%
1 ene 1987 año
2.297 mil
+439.746
23.68%
1 ene 1988 año
2.03 mil
-267.369
-11.64%
1 ene 1989 año
2.797 mil
+766.931
37.79%
1 ene 1990 año
2.678 mil
-118.915
-4.25%
1 ene 1991 año
2.945 mil
+267.377
9.99%
1 ene 1992 año
2.634 mil
-310.691
-10.55%
1 ene 1993 año
2.604 mil
-30.348
-1.15%
1 ene 1994 año
1.682 mil
-922.409
-35.42%
1 ene 1995 año
1.732 mil
+50.78
3.02%
1 ene 1996 año
1.952 mil
+219.396
12.66%
1 ene 1997 año
2.282 mil
+329.889
16.9%
1 ene 1998 año
2.084 mil
-197.73
-8.67%
1 ene 1999 año
2.125 mil
+41.032
1.97%
1 ene 2000 año
1.872 mil
-252.678
-11.89%
1 ene 2001 año
1.615 mil
-257.518
-13.75%
1 ene 2002 año
1.96 mil
+345.615
21.4%
1 ene 2003 año
2.224 mil
+263.816
13.46%
1 ene 2004 año
2.467 mil
+242.572
10.91%
1 ene 2005 año
2.416 mil
-50.748
-2.06%
1 ene 2006 año
2.916 mil
+499.776
20.69%
1 ene 2007 año
2.925 mil
+8.989
0.31%
1 ene 2008 año
3.657 mil
+732.346
25.04%
1 ene 2009 año
4.376 mil
+718.532
19.65%
1 ene 2010 año
4.288 mil
-87.535
-2.0%
1 ene 2011 año
4.129 mil
-159.069
-3.71%
1 ene 2012 año
4.877 mil
+747.47
18.1%
1 ene 2013 año
4.373 mil
-503.349
-10.32%
1 ene 2014 año
4.787 mil
+413.543
9.46%
1 ene 2015 año
5.45 mil
+663.512
13.86%
Ranking de los países por los datos estadísticos actuales


Comentarios: