29
/es/
es
AIzaSyAYiBZKx7MnpbEhh9jyipgxe19OcubqV5w
April 1, 2024
147587
Guyana
GUY
true
2
1
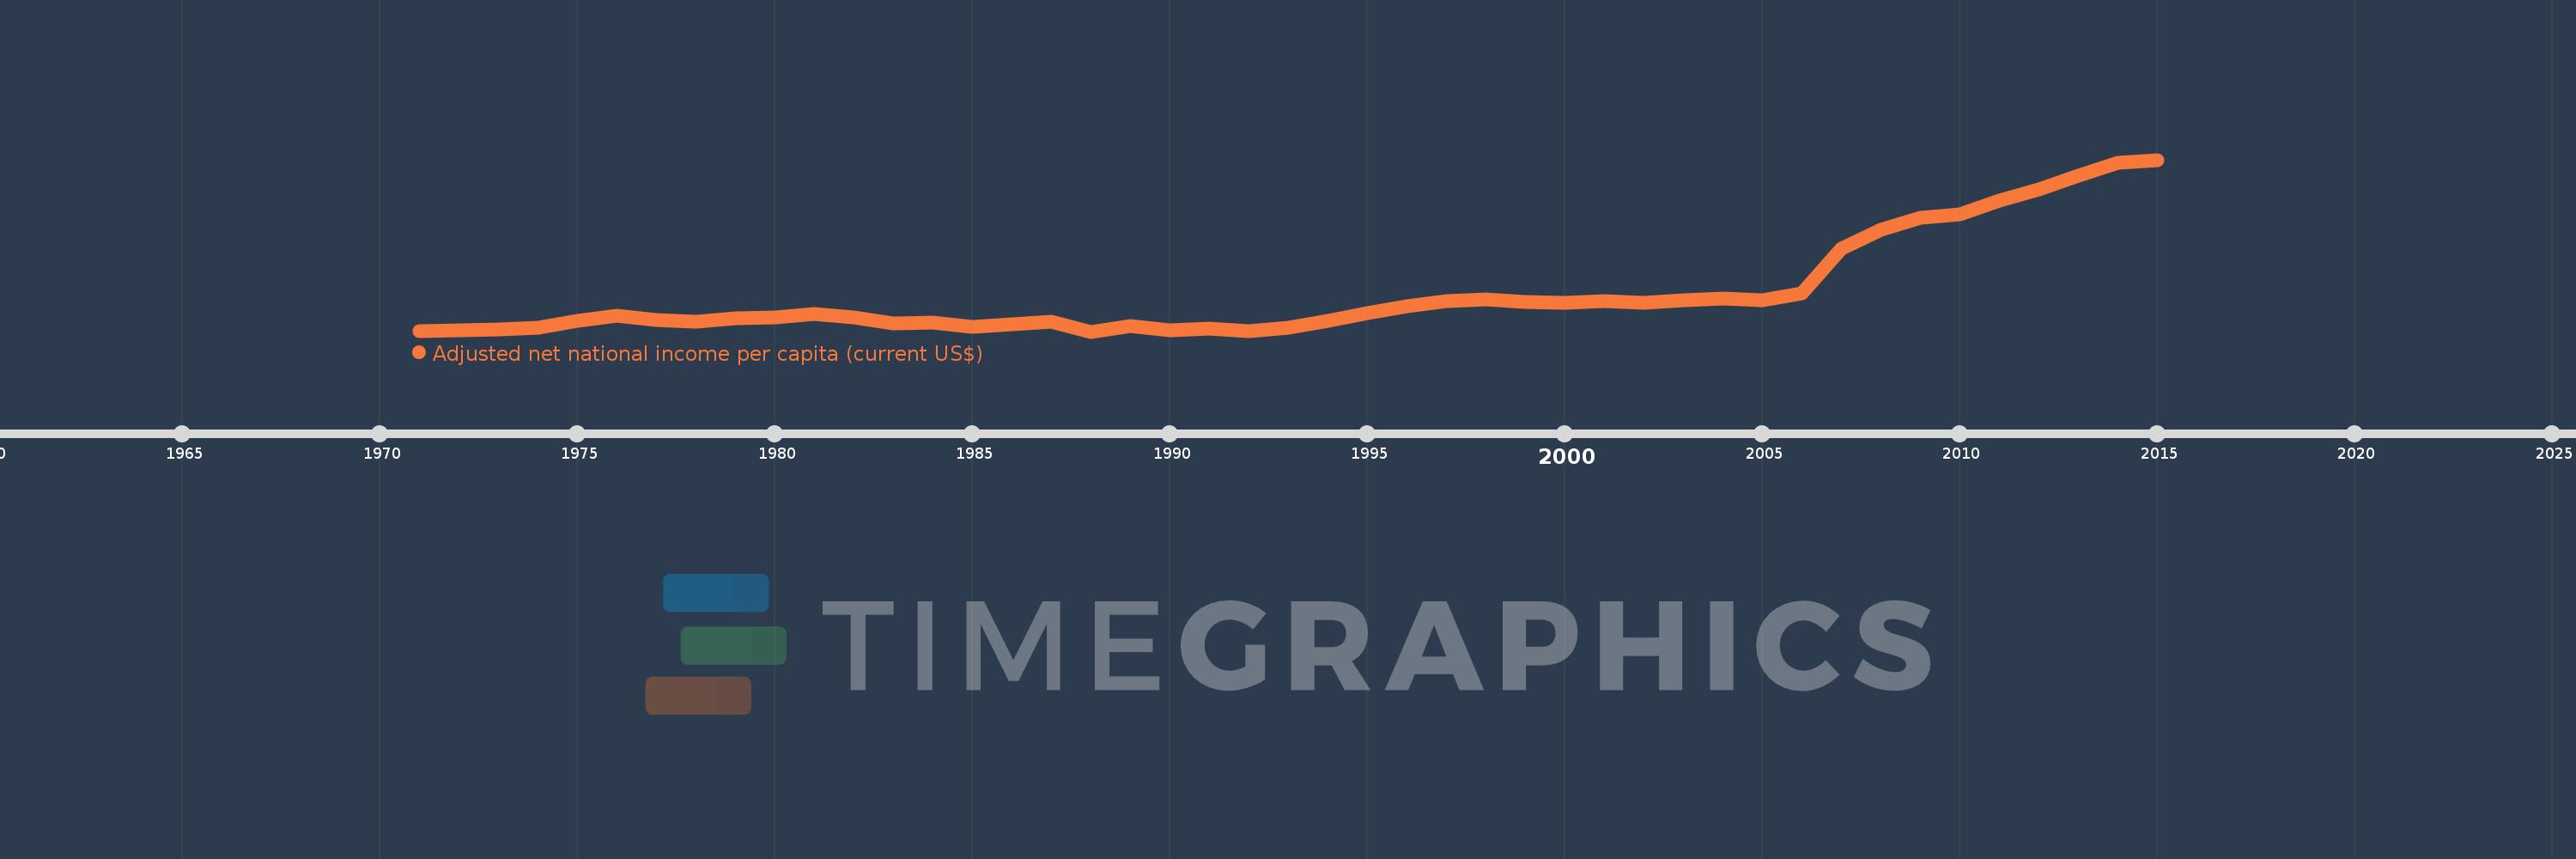
Adjusted net national income per capita (current US$)
2015,2014,2013,2012,2011,2010,2009,2008,2007,2006,2005,2004,2003,2002,2001,2000,1999,1998,1997,1996,1995,1994,1993,1992,1991,1990,1989,1988,1987,1986,1985,1984,1983,1982,1981,1980,1979,1978,1977,1976,1975,1974,1973,1972,1971
Estas estadísticas en otros países:
AfghanistanAlbaniaAlgeriaAngolaArab WorldArgentinaArmeniaAustraliaAustriaAzerbaijanBahamas, TheBahrainBangladeshBarbadosBelarusBelgiumBelizeBeninBhutanBoliviaBotswanaBrazilBrunei DarussalamBulgariaBurkina FasoBurundiCabo VerdeCambodiaCameroonCanadaCaribbean small statesCentral African RepublicCentral Europe and the BalticsChadChileChinaColombiaComorosCongo, Dem. Rep.Congo, Rep.Costa RicaCote d'IvoireCroatiaCubaCyprusCzech RepublicDenmarkDjiboutiDominicaDominican RepublicEarly-demographic dividendEast Asia & PacificEast Asia & Pacific (excluding high income)East Asia & Pacific (IDA & IBRD countries)EcuadorEgypt, Arab Rep.El SalvadorEquatorial GuineaEritreaEstoniaEthiopiaEuro areaEurope & Central AsiaEurope & Central Asia (excluding high income)Europe & Central Asia (IDA & IBRD countries)European UnionFijiFinlandFragile and conflict affected situationsFranceGabonGambia, TheGeorgiaGermanyGhanaGreeceGuatemalaGuineaGuinea-BissauGuyanaHaitiHeavily indebted poor countries (HIPC)High incomeHondurasHong Kong SAR, ChinaHungaryIBRD onlyIcelandIDA & IBRD totalIDA blendIDA onlyIDA totalIndiaIndonesiaIran, Islamic Rep.IraqIrelandIsraelItalyJamaicaJapanJordanKazakhstanKenyaKiribatiKorea, Rep.KuwaitKyrgyz RepublicLao PDRLate-demographic dividendLatin America & Caribbean Latin America & Caribbean (excluding high income)Latin America & the Caribbean (IDA & IBRD countries)LatviaLeast developed countries: UN classificationLebanonLesothoLiberiaLibyaLithuaniaLow & middle incomeLow incomeLower middle incomeLuxembourgMacedonia, FYRMadagascarMalawiMalaysiaMaldivesMaliMauritaniaMauritiusMexicoMiddle East & North AfricaMiddle East & North Africa (excluding high income)Middle East & North Africa (IDA & IBRD countries)Middle incomeMoldovaMongoliaMoroccoMozambiqueMyanmarNamibiaNepalNetherlandsNew ZealandNicaraguaNigerNigeriaNorth AmericaNorwayOECD membersOmanOther small statesPacific island small statesPakistanPanamaPapua New GuineaParaguayPeruPhilippinesPolandPortugalPost-demographic dividendPre-demographic dividendQatarRomaniaRussian FederationRwandaSamoaSao Tome and PrincipeSaudi ArabiaSenegalSeychellesSierra LeoneSingaporeSlovak RepublicSloveniaSmall statesSolomon IslandsSouth AfricaSouth AsiaSouth Asia (IDA & IBRD)SpainSri LankaSt. LuciaSt. Vincent and the GrenadinesSub-Saharan Africa Sub-Saharan Africa (excluding high income)Sub-Saharan Africa (IDA & IBRD countries)SudanSurinameSwazilandSwedenSwitzerlandSyrian Arab RepublicTajikistanTanzaniaThailandTogoTongaTrinidad and TobagoTunisiaTurkeyTurkmenistanUgandaUkraineUnited Arab EmiratesUnited KingdomUnited StatesUpper middle incomeUruguayUzbekistanVanuatuVenezuela, RBVietnamWorldYemen, Rep.ZambiaZimbabwe línea de tiempo (timeline):
En esta escala de tiempo se presenta un gráfico de 1971 y 2015 de Guyana. Los datos de 1970 están ausentes. El número de observaciones reales por fecha: 45.
Fuente (nombre):
Indicadores del desarrollo mundial
Fuente (organización):
World Bank staff estimates based on sources and methods in World Bank's "The Changing Wealth of Nations: Measuring Sustainable Development in the New Millennium" (2011).
Categorías:
Economy & Growth
Se ha actualizado:
23 abr 2017 año
Los indicadores de los cambios de valor en los últimos años
Mínimo:
297.257
1 ene 1988 año
Máximo:
3.424 mil
1 ene 2015 año
A la fecha de observación
Valor
Cambio absoluto
El cambio con respecto al valor anterior
1 ene 1971 año
304.277
+304.277
0.0%
1 ene 1972 año
327.322
+23.045
7.57%
1 ene 1973 año
343.512
+16.19
4.95%
1 ene 1974 año
361.796
+18.284
5.32%
1 ene 1975 año
497.791
+135.995
37.59%
1 ene 1976 año
584.41
+86.619
17.4%
1 ene 1977 año
506.696
-77.715
-13.3%
1 ene 1978 año
475.047
-31.649
-6.25%
1 ene 1979 año
536.484
+61.438
12.93%
1 ene 1980 año
550.614
+14.129
2.63%
1 ene 1981 año
619.965
+69.351
12.6%
1 ene 1982 año
559.067
-60.897
-9.82%
1 ene 1983 año
451.593
-107.474
-19.22%
1 ene 1984 año
467.158
+15.565
3.45%
1 ene 1985 año
386.763
-80.395
-17.21%
1 ene 1986 año
428.285
+41.521
10.74%
1 ene 1987 año
471.974
+43.69
10.2%
1 ene 1988 año
297.257
-174.718
-37.02%
1 ene 1989 año
392.022
+94.765
31.88%
1 ene 1990 año
321.738
-70.284
-17.93%
1 ene 1991 año
351.622
+29.884
9.29%
1 ene 1992 año
306.401
-45.222
-12.86%
1 ene 1993 año
372.515
+66.115
21.58%
1 ene 1994 año
486.752
+114.236
30.67%
1 ene 1995 año
631.261
+144.51
29.69%
1 ene 1996 año
753.986
+122.725
19.44%
1 ene 1997 año
852.707
+98.721
13.09%
1 ene 1998 año
878.336
+25.629
3.01%
1 ene 1999 año
841.059
-37.277
-4.24%
1 ene 2000 año
827.686
-13.374
-1.59%
1 ene 2001 año
851.599
+23.914
2.89%
1 ene 2002 año
821.368
-30.232
-3.55%
1 ene 2003 año
866.578
+45.211
5.5%
1 ene 2004 año
895.324
+28.746
3.32%
1 ene 2005 año
863.499
-31.826
-3.55%
1 ene 2006 año
992.911
+129.413
14.99%
1 ene 2007 año
1.806 mil
+813.236
81.9%
1 ene 2008 año
2.151 mil
+344.804
19.09%
1 ene 2009 año
2.366 mil
+214.681
9.98%
1 ene 2010 año
2.435 mil
+69.013
2.92%
1 ene 2011 año
2.675 mil
+240.674
9.89%
1 ene 2012 año
2.881 mil
+205.459
7.68%
1 ene 2013 año
3.13 mil
+248.797
8.64%
1 ene 2014 año
3.366 mil
+236.335
7.55%
1 ene 2015 año
3.424 mil
+58.305
1.73%
Ranking de los países por los datos estadísticos actuales


Comentarios: