29
/es/
es
AIzaSyAYiBZKx7MnpbEhh9jyipgxe19OcubqV5w
April 1, 2024
46816
Lower middle income
LMC
false
2
1
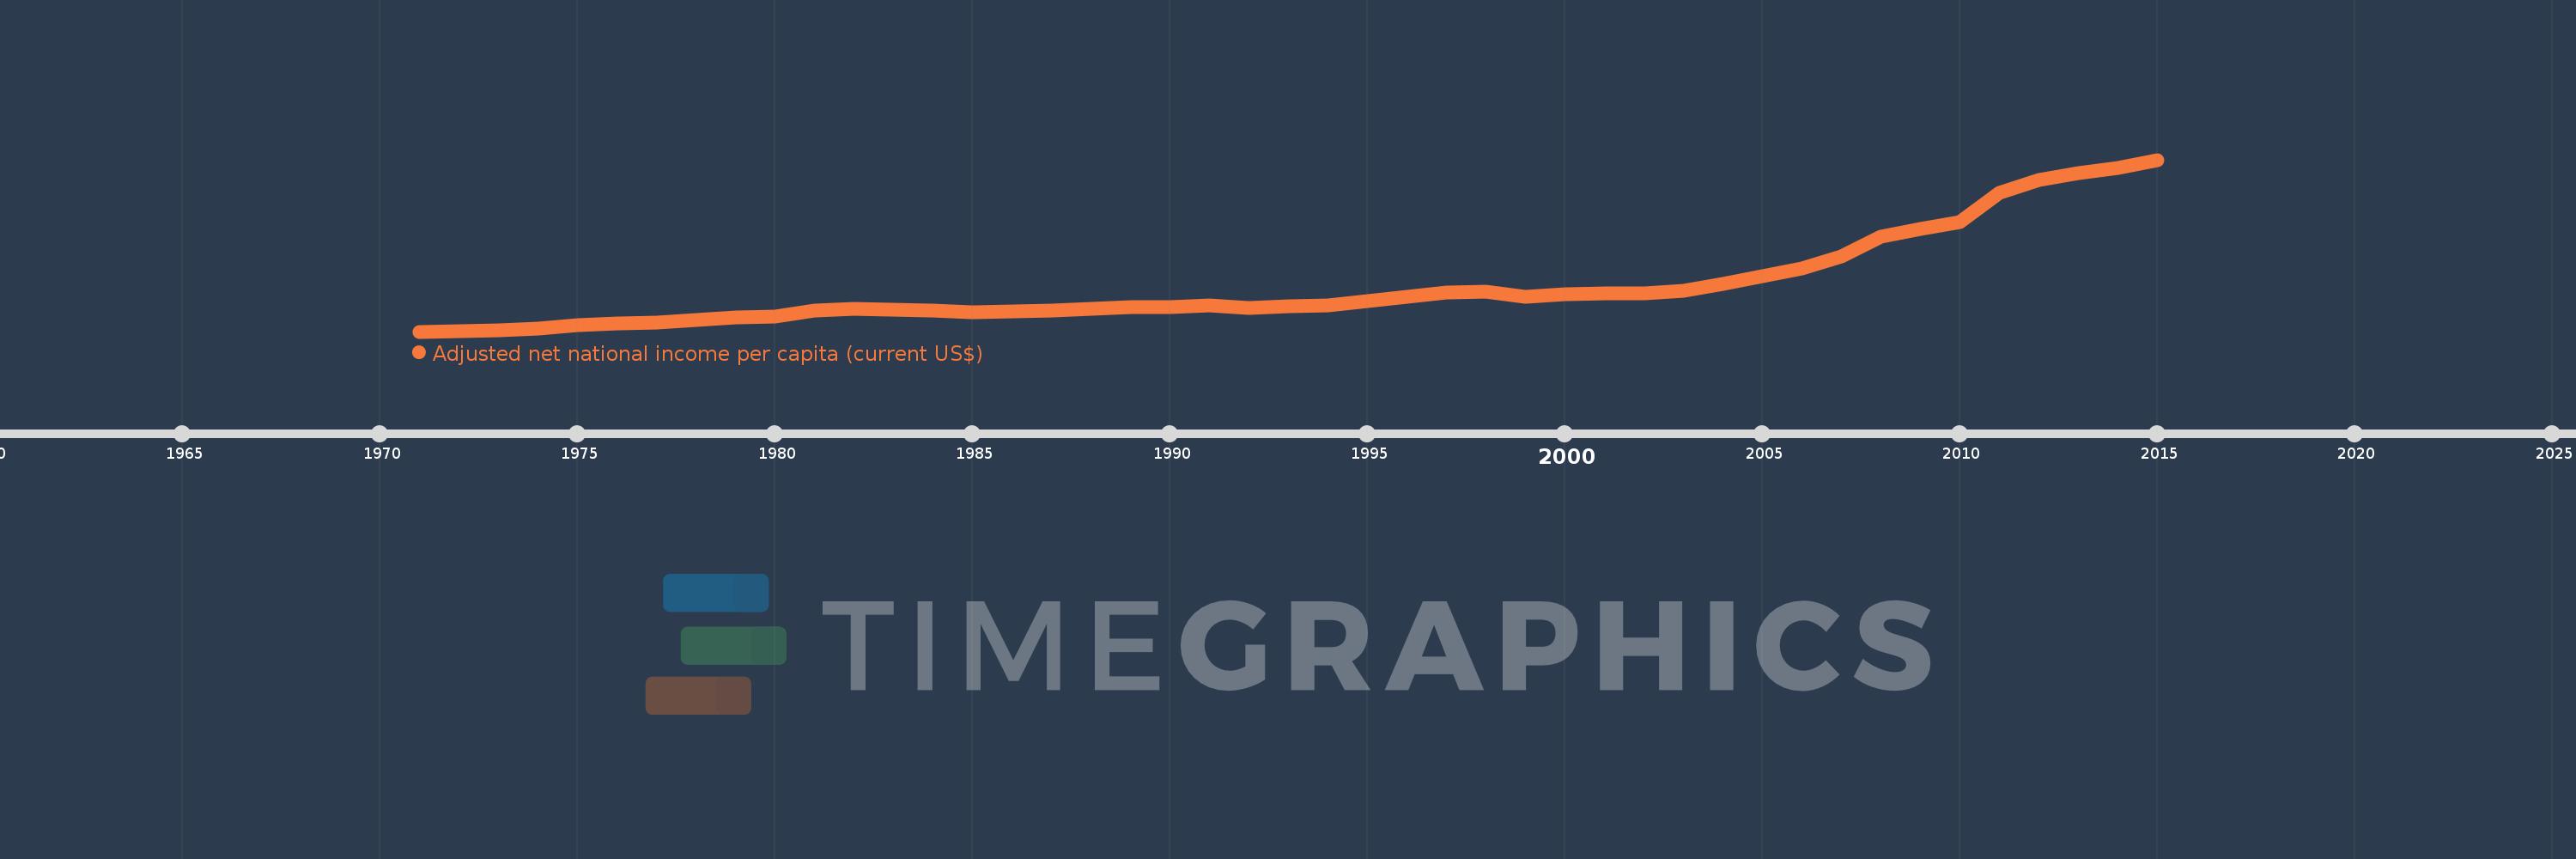
Adjusted net national income per capita (current US$)
2015,2014,2013,2012,2011,2010,2009,2008,2007,2006,2005,2004,2003,2002,2001,2000,1999,1998,1997,1996,1995,1994,1993,1992,1991,1990,1989,1988,1987,1986,1985,1984,1983,1982,1981,1980,1979,1978,1977,1976,1975,1974,1973,1972,1971
Estas estadísticas en otros países:
AfghanistanAlbaniaAlgeriaAngolaArab WorldArgentinaArmeniaAustraliaAustriaAzerbaijanBahamas, TheBahrainBangladeshBarbadosBelarusBelgiumBelizeBeninBhutanBoliviaBotswanaBrazilBrunei DarussalamBulgariaBurkina FasoBurundiCabo VerdeCambodiaCameroonCanadaCaribbean small statesCentral African RepublicCentral Europe and the BalticsChadChileChinaColombiaComorosCongo, Dem. Rep.Congo, Rep.Costa RicaCote d'IvoireCroatiaCubaCyprusCzech RepublicDenmarkDjiboutiDominicaDominican RepublicEarly-demographic dividendEast Asia & PacificEast Asia & Pacific (excluding high income)East Asia & Pacific (IDA & IBRD countries)EcuadorEgypt, Arab Rep.El SalvadorEquatorial GuineaEritreaEstoniaEthiopiaEuro areaEurope & Central AsiaEurope & Central Asia (excluding high income)Europe & Central Asia (IDA & IBRD countries)European UnionFijiFinlandFragile and conflict affected situationsFranceGabonGambia, TheGeorgiaGermanyGhanaGreeceGuatemalaGuineaGuinea-BissauGuyanaHaitiHeavily indebted poor countries (HIPC)High incomeHondurasHong Kong SAR, ChinaHungaryIBRD onlyIcelandIDA & IBRD totalIDA blendIDA onlyIDA totalIndiaIndonesiaIran, Islamic Rep.IraqIrelandIsraelItalyJamaicaJapanJordanKazakhstanKenyaKiribatiKorea, Rep.KuwaitKyrgyz RepublicLao PDRLate-demographic dividendLatin America & Caribbean Latin America & Caribbean (excluding high income)Latin America & the Caribbean (IDA & IBRD countries)LatviaLeast developed countries: UN classificationLebanonLesothoLiberiaLibyaLithuaniaLow & middle incomeLow incomeLower middle incomeLuxembourgMacedonia, FYRMadagascarMalawiMalaysiaMaldivesMaliMauritaniaMauritiusMexicoMiddle East & North AfricaMiddle East & North Africa (excluding high income)Middle East & North Africa (IDA & IBRD countries)Middle incomeMoldovaMongoliaMoroccoMozambiqueMyanmarNamibiaNepalNetherlandsNew ZealandNicaraguaNigerNigeriaNorth AmericaNorwayOECD membersOmanOther small statesPacific island small statesPakistanPanamaPapua New GuineaParaguayPeruPhilippinesPolandPortugalPost-demographic dividendPre-demographic dividendQatarRomaniaRussian FederationRwandaSamoaSao Tome and PrincipeSaudi ArabiaSenegalSeychellesSierra LeoneSingaporeSlovak RepublicSloveniaSmall statesSolomon IslandsSouth AfricaSouth AsiaSouth Asia (IDA & IBRD)SpainSri LankaSt. LuciaSt. Vincent and the GrenadinesSub-Saharan Africa Sub-Saharan Africa (excluding high income)Sub-Saharan Africa (IDA & IBRD countries)SudanSurinameSwazilandSwedenSwitzerlandSyrian Arab RepublicTajikistanTanzaniaThailandTogoTongaTrinidad and TobagoTunisiaTurkeyTurkmenistanUgandaUkraineUnited Arab EmiratesUnited KingdomUnited StatesUpper middle incomeUruguayUzbekistanVanuatuVenezuela, RBVietnamWorldYemen, Rep.ZambiaZimbabwe línea de tiempo (timeline):
En esta escala de tiempo se presenta un gráfico de 1971 y 2015 de Lower middle income. Los datos de 1970 están ausentes. El número de observaciones reales por fecha: 45.
Fuente (nombre):
Indicadores del desarrollo mundial
Fuente (organización):
World Bank staff estimates based on sources and methods in World Bank's "The Changing Wealth of Nations: Measuring Sustainable Development in the New Millennium" (2011).
Categorías:
Economy & Growth
Se ha actualizado:
23 abr 2017 año
Los indicadores de los cambios de valor en los últimos años
Mínimo:
122.011
1 ene 1971 año
Máximo:
1.777 mil
1 ene 2015 año
A la fecha de observación
Valor
Cambio absoluto
El cambio con respecto al valor anterior
1 ene 1971 año
122.011
+122.011
0.0%
1 ene 1972 año
124.356
+2.345
1.92%
1 ene 1973 año
130.851
+6.496
5.22%
1 ene 1974 año
150.082
+19.231
14.7%
1 ene 1975 año
181.585
+31.503
20.99%
1 ene 1976 año
196.89
+15.305
8.43%
1 ene 1977 año
208.309
+11.419
5.8%
1 ene 1978 año
231.944
+23.635
11.35%
1 ene 1979 año
256.523
+24.579
10.6%
1 ene 1980 año
264.419
+7.895
3.08%
1 ene 1981 año
323.947
+59.528
22.51%
1 ene 1982 año
343.155
+19.208
5.93%
1 ene 1983 año
335.705
-7.45
-2.17%
1 ene 1984 año
326.178
-9.527
-2.84%
1 ene 1985 año
310.436
-15.742
-4.83%
1 ene 1986 año
319.663
+9.227
2.97%
1 ene 1987 año
323.903
+4.24
1.33%
1 ene 1988 año
342.497
+18.594
5.74%
1 ene 1989 año
361.258
+18.761
5.48%
1 ene 1990 año
360.065
-1.193
-0.33%
1 ene 1991 año
376.554
+16.49
4.58%
1 ene 1992 año
349.976
-26.578
-7.06%
1 ene 1993 año
369.834
+19.858
5.67%
1 ene 1994 año
374.532
+4.698
1.27%
1 ene 1995 año
413.539
+39.007
10.41%
1 ene 1996 año
460.524
+46.985
11.36%
1 ene 1997 año
499.123
+38.599
8.38%
1 ene 1998 año
507.909
+8.786
1.76%
1 ene 1999 año
455.815
-52.095
-10.26%
1 ene 2000 año
485.631
+29.816
6.54%
1 ene 2001 año
489.02
+3.389
0.7%
1 ene 2002 año
489.203
+0.183
0.04%
1 ene 2003 año
516.794
+27.591
5.64%
1 ene 2004 año
585.014
+68.22
13.2%
1 ene 2005 año
652.391
+67.377
11.52%
1 ene 2006 año
726.109
+73.718
11.3%
1 ene 2007 año
850.136
+124.027
17.08%
1 ene 2008 año
1.033 mil
+182.653
21.49%
1 ene 2009 año
1.11 mil
+77.524
7.51%
1 ene 2010 año
1.176 mil
+65.841
5.93%
1 ene 2011 año
1.457 mil
+280.518
23.85%
1 ene 2012 año
1.582 mil
+125.502
8.62%
1 ene 2013 año
1.652 mil
+69.425
4.39%
1 ene 2014 año
1.7 mil
+48.684
2.95%
1 ene 2015 año
1.777 mil
+76.692
4.51%
Ranking de los países por los datos estadísticos actuales


Comentarios: