29
/es/
es
AIzaSyAYiBZKx7MnpbEhh9jyipgxe19OcubqV5w
April 1, 2024
39673
IDA total
IDA
false
2
1
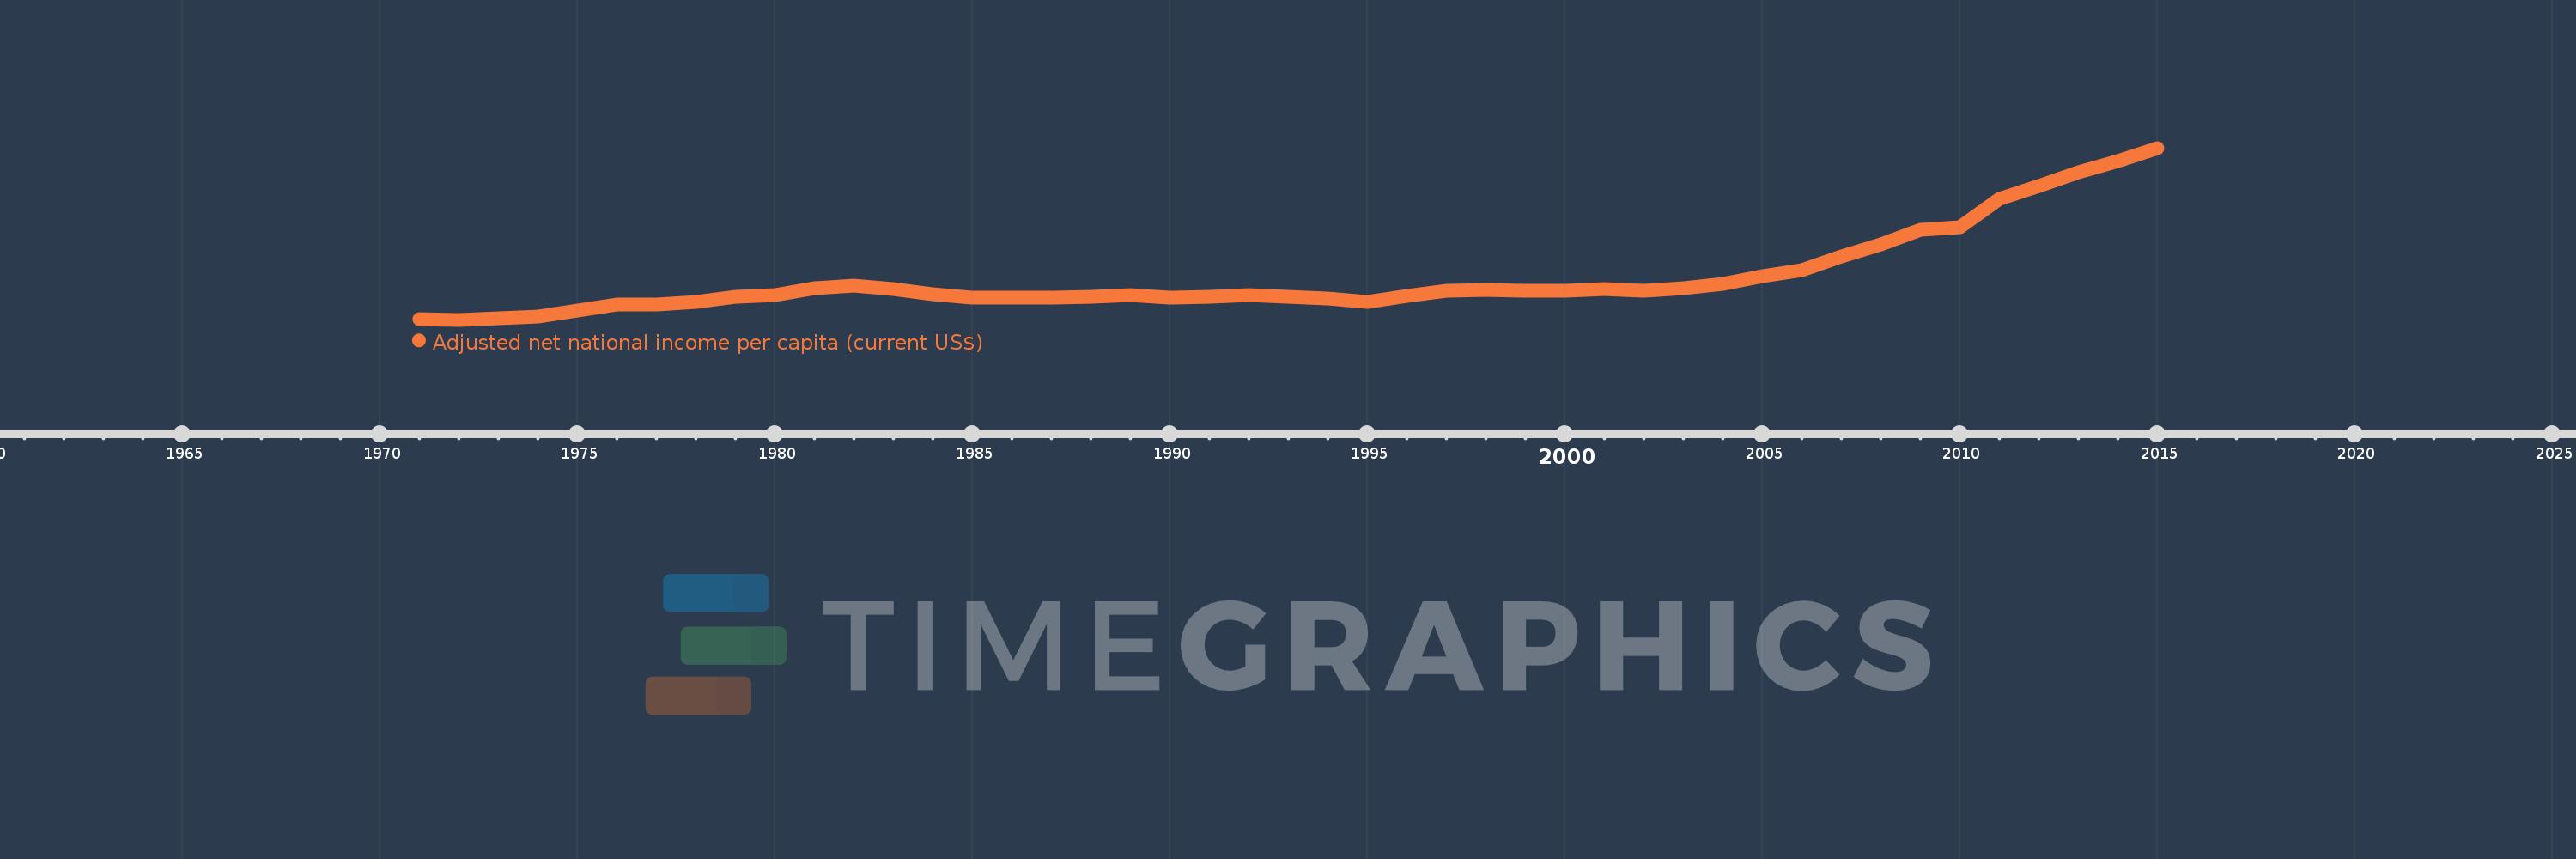
Adjusted net national income per capita (current US$)
2015,2014,2013,2012,2011,2010,2009,2008,2007,2006,2005,2004,2003,2002,2001,2000,1999,1998,1997,1996,1995,1994,1993,1992,1991,1990,1989,1988,1987,1986,1985,1984,1983,1982,1981,1980,1979,1978,1977,1976,1975,1974,1973,1972,1971
Estas estadísticas en otros países:
AfghanistanAlbaniaAlgeriaAngolaArab WorldArgentinaArmeniaAustraliaAustriaAzerbaijanBahamas, TheBahrainBangladeshBarbadosBelarusBelgiumBelizeBeninBhutanBoliviaBotswanaBrazilBrunei DarussalamBulgariaBurkina FasoBurundiCabo VerdeCambodiaCameroonCanadaCaribbean small statesCentral African RepublicCentral Europe and the BalticsChadChileChinaColombiaComorosCongo, Dem. Rep.Congo, Rep.Costa RicaCote d'IvoireCroatiaCubaCyprusCzech RepublicDenmarkDjiboutiDominicaDominican RepublicEarly-demographic dividendEast Asia & PacificEast Asia & Pacific (excluding high income)East Asia & Pacific (IDA & IBRD countries)EcuadorEgypt, Arab Rep.El SalvadorEquatorial GuineaEritreaEstoniaEthiopiaEuro areaEurope & Central AsiaEurope & Central Asia (excluding high income)Europe & Central Asia (IDA & IBRD countries)European UnionFijiFinlandFragile and conflict affected situationsFranceGabonGambia, TheGeorgiaGermanyGhanaGreeceGuatemalaGuineaGuinea-BissauGuyanaHaitiHeavily indebted poor countries (HIPC)High incomeHondurasHong Kong SAR, ChinaHungaryIBRD onlyIcelandIDA & IBRD totalIDA blendIDA onlyIDA totalIndiaIndonesiaIran, Islamic Rep.IraqIrelandIsraelItalyJamaicaJapanJordanKazakhstanKenyaKiribatiKorea, Rep.KuwaitKyrgyz RepublicLao PDRLate-demographic dividendLatin America & Caribbean Latin America & Caribbean (excluding high income)Latin America & the Caribbean (IDA & IBRD countries)LatviaLeast developed countries: UN classificationLebanonLesothoLiberiaLibyaLithuaniaLow & middle incomeLow incomeLower middle incomeLuxembourgMacedonia, FYRMadagascarMalawiMalaysiaMaldivesMaliMauritaniaMauritiusMexicoMiddle East & North AfricaMiddle East & North Africa (excluding high income)Middle East & North Africa (IDA & IBRD countries)Middle incomeMoldovaMongoliaMoroccoMozambiqueMyanmarNamibiaNepalNetherlandsNew ZealandNicaraguaNigerNigeriaNorth AmericaNorwayOECD membersOmanOther small statesPacific island small statesPakistanPanamaPapua New GuineaParaguayPeruPhilippinesPolandPortugalPost-demographic dividendPre-demographic dividendQatarRomaniaRussian FederationRwandaSamoaSao Tome and PrincipeSaudi ArabiaSenegalSeychellesSierra LeoneSingaporeSlovak RepublicSloveniaSmall statesSolomon IslandsSouth AfricaSouth AsiaSouth Asia (IDA & IBRD)SpainSri LankaSt. LuciaSt. Vincent and the GrenadinesSub-Saharan Africa Sub-Saharan Africa (excluding high income)Sub-Saharan Africa (IDA & IBRD countries)SudanSurinameSwazilandSwedenSwitzerlandSyrian Arab RepublicTajikistanTanzaniaThailandTogoTongaTrinidad and TobagoTunisiaTurkeyTurkmenistanUgandaUkraineUnited Arab EmiratesUnited KingdomUnited StatesUpper middle incomeUruguayUzbekistanVanuatuVenezuela, RBVietnamWorldYemen, Rep.ZambiaZimbabwe línea de tiempo (timeline):
En esta escala de tiempo se presenta un gráfico de 1971 y 2015 de IDA total. Los datos de 1970 están ausentes. El número de observaciones reales por fecha: 45.
Fuente (nombre):
Indicadores del desarrollo mundial
Fuente (organización):
World Bank staff estimates based on sources and methods in World Bank's "The Changing Wealth of Nations: Measuring Sustainable Development in the New Millennium" (2011).
Categorías:
Economy & Growth
Se ha actualizado:
23 abr 2017 año
Los indicadores de los cambios de valor en los últimos años
Mínimo:
138.578
1 ene 1972 año
Máximo:
1.249 mil
1 ene 2015 año
A la fecha de observación
Valor
Cambio absoluto
El cambio con respecto al valor anterior
1 ene 1971 año
141.455
+141.455
0.0%
1 ene 1972 año
138.578
-2.876
-2.03%
1 ene 1973 año
146.417
+7.838
5.66%
1 ene 1974 año
156.587
+10.17
6.95%
1 ene 1975 año
199.458
+42.87
27.38%
1 ene 1976 año
239.454
+39.996
20.05%
1 ene 1977 año
238.738
-0.715
-0.3%
1 ene 1978 año
252.882
+14.144
5.92%
1 ene 1979 año
284.365
+31.483
12.45%
1 ene 1980 año
296.616
+12.251
4.31%
1 ene 1981 año
341.451
+44.835
15.12%
1 ene 1982 año
360.493
+19.042
5.58%
1 ene 1983 año
338.84
-21.653
-6.01%
1 ene 1984 año
301.702
-37.138
-10.96%
1 ene 1985 año
282.776
-18.926
-6.27%
1 ene 1986 año
281.134
-1.642
-0.58%
1 ene 1987 año
281.892
+0.757
0.27%
1 ene 1988 año
287.757
+5.866
2.08%
1 ene 1989 año
299.756
+11.998
4.17%
1 ene 1990 año
283.867
-15.889
-5.3%
1 ene 1991 año
289.284
+5.417
1.91%
1 ene 1992 año
295.482
+6.198
2.14%
1 ene 1993 año
286.58
-8.902
-3.01%
1 ene 1994 año
275.209
-11.371
-3.97%
1 ene 1995 año
256.174
-19.035
-6.92%
1 ene 1996 año
293.504
+37.329
14.57%
1 ene 1997 año
323.797
+30.293
10.32%
1 ene 1998 año
328.557
+4.76
1.47%
1 ene 1999 año
328.076
-0.481
-0.15%
1 ene 2000 año
326.395
-1.681
-0.51%
1 ene 2001 año
336.52
+10.124
3.1%
1 ene 2002 año
326.555
-9.965
-2.96%
1 ene 2003 año
344.883
+18.328
5.61%
1 ene 2004 año
371.821
+26.938
7.81%
1 ene 2005 año
417.357
+45.536
12.25%
1 ene 2006 año
459.421
+42.063
10.08%
1 ene 2007 año
546.211
+86.79
18.89%
1 ene 2008 año
623.782
+77.572
14.2%
1 ene 2009 año
720.731
+96.949
15.54%
1 ene 2010 año
738.214
+17.484
2.43%
1 ene 2011 año
916.869
+178.655
24.2%
1 ene 2012 año
1.005 mil
+87.911
9.59%
1 ene 2013 año
1.091 mil
+86.697
8.63%
1 ene 2014 año
1.165 mil
+73.477
6.73%
1 ene 2015 año
1.249 mil
+83.602
7.18%
Ranking de los países por los datos estadísticos actuales


Comentarios: