29
/es/
es
AIzaSyAYiBZKx7MnpbEhh9jyipgxe19OcubqV5w
April 1, 2024
155531
Indonesia
IDN
true
2
1
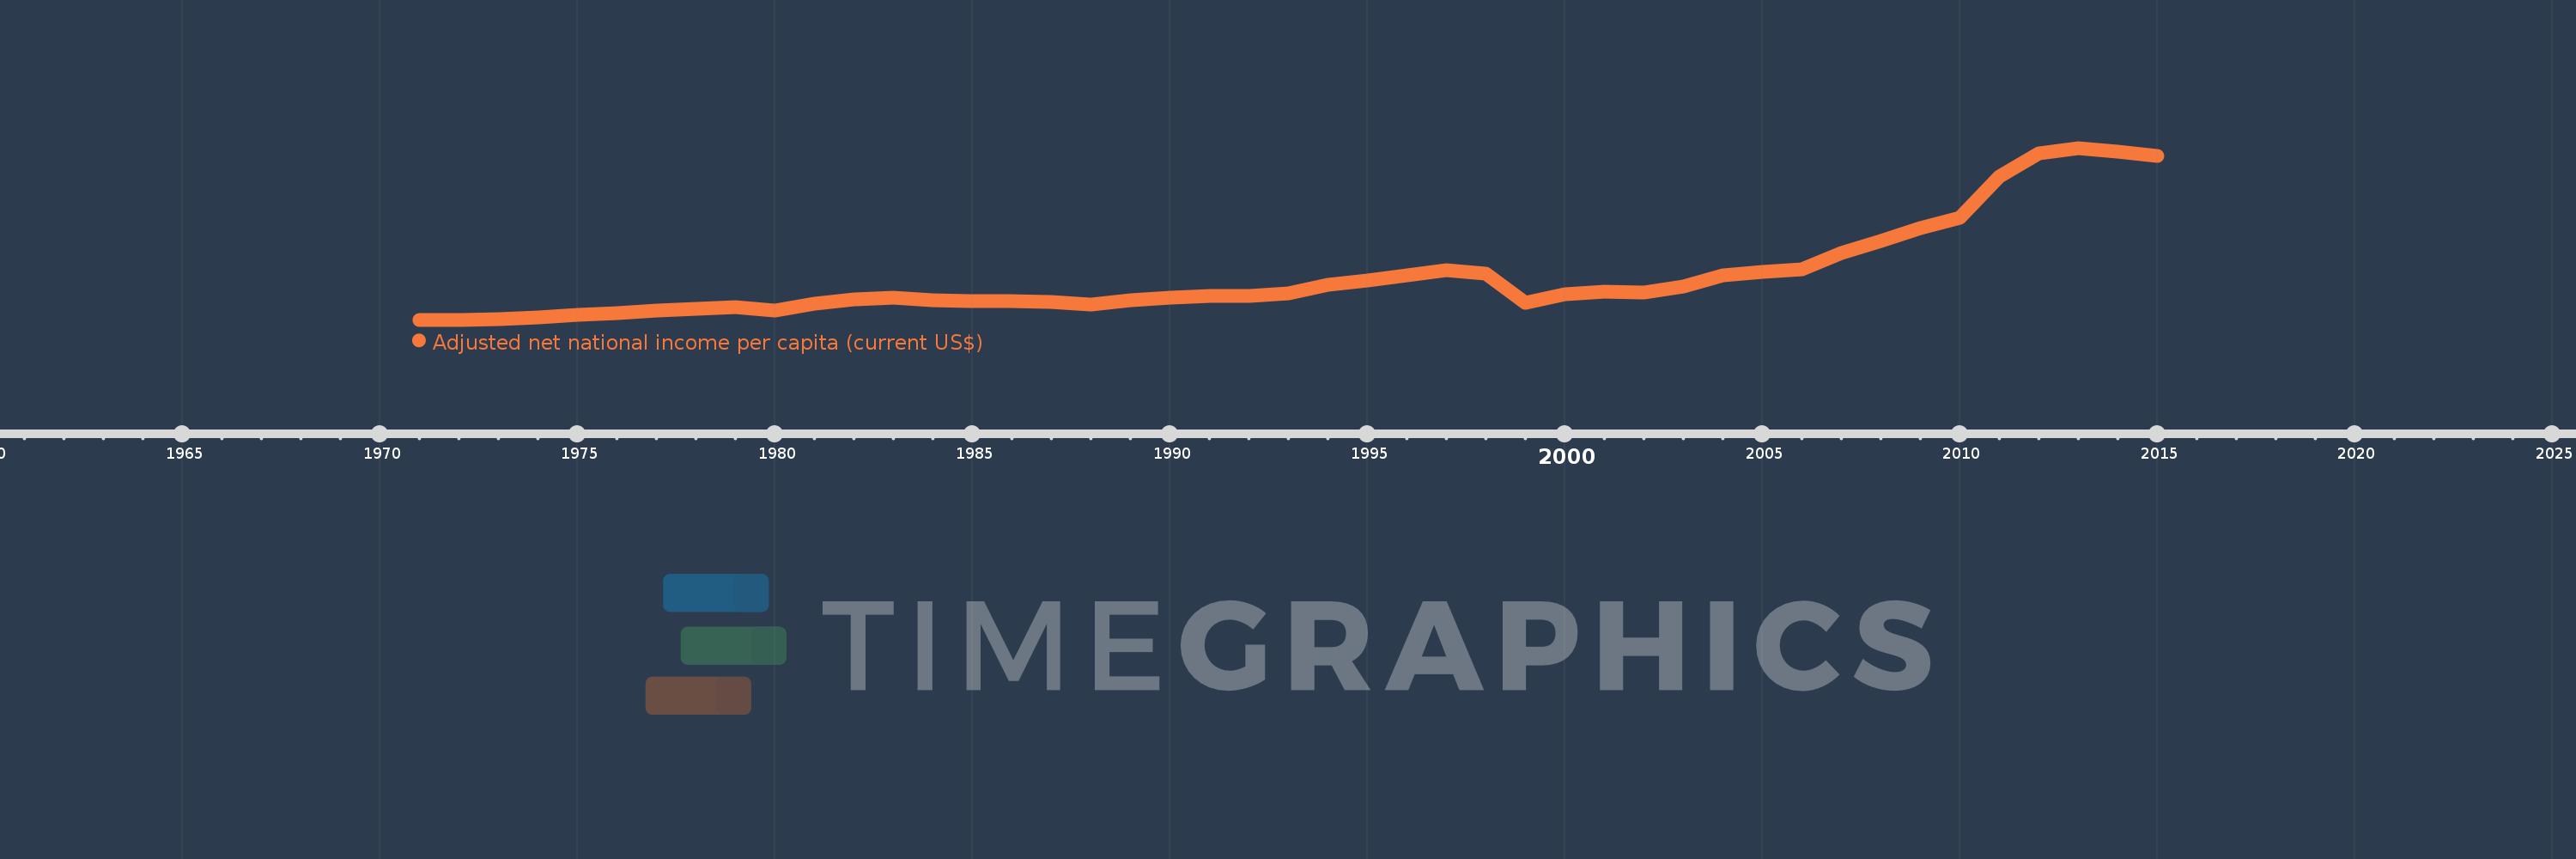
Adjusted net national income per capita (current US$)
2015,2014,2013,2012,2011,2010,2009,2008,2007,2006,2005,2004,2003,2002,2001,2000,1999,1998,1997,1996,1995,1994,1993,1992,1991,1990,1989,1988,1987,1986,1985,1984,1983,1982,1981,1980,1979,1978,1977,1976,1975,1974,1973,1972,1971
Estas estadísticas en otros países:
AfghanistanAlbaniaAlgeriaAngolaArab WorldArgentinaArmeniaAustraliaAustriaAzerbaijanBahamas, TheBahrainBangladeshBarbadosBelarusBelgiumBelizeBeninBhutanBoliviaBotswanaBrazilBrunei DarussalamBulgariaBurkina FasoBurundiCabo VerdeCambodiaCameroonCanadaCaribbean small statesCentral African RepublicCentral Europe and the BalticsChadChileChinaColombiaComorosCongo, Dem. Rep.Congo, Rep.Costa RicaCote d'IvoireCroatiaCubaCyprusCzech RepublicDenmarkDjiboutiDominicaDominican RepublicEarly-demographic dividendEast Asia & PacificEast Asia & Pacific (excluding high income)East Asia & Pacific (IDA & IBRD countries)EcuadorEgypt, Arab Rep.El SalvadorEquatorial GuineaEritreaEstoniaEthiopiaEuro areaEurope & Central AsiaEurope & Central Asia (excluding high income)Europe & Central Asia (IDA & IBRD countries)European UnionFijiFinlandFragile and conflict affected situationsFranceGabonGambia, TheGeorgiaGermanyGhanaGreeceGuatemalaGuineaGuinea-BissauGuyanaHaitiHeavily indebted poor countries (HIPC)High incomeHondurasHong Kong SAR, ChinaHungaryIBRD onlyIcelandIDA & IBRD totalIDA blendIDA onlyIDA totalIndiaIndonesiaIran, Islamic Rep.IraqIrelandIsraelItalyJamaicaJapanJordanKazakhstanKenyaKiribatiKorea, Rep.KuwaitKyrgyz RepublicLao PDRLate-demographic dividendLatin America & Caribbean Latin America & Caribbean (excluding high income)Latin America & the Caribbean (IDA & IBRD countries)LatviaLeast developed countries: UN classificationLebanonLesothoLiberiaLibyaLithuaniaLow & middle incomeLow incomeLower middle incomeLuxembourgMacedonia, FYRMadagascarMalawiMalaysiaMaldivesMaliMauritaniaMauritiusMexicoMiddle East & North AfricaMiddle East & North Africa (excluding high income)Middle East & North Africa (IDA & IBRD countries)Middle incomeMoldovaMongoliaMoroccoMozambiqueMyanmarNamibiaNepalNetherlandsNew ZealandNicaraguaNigerNigeriaNorth AmericaNorwayOECD membersOmanOther small statesPacific island small statesPakistanPanamaPapua New GuineaParaguayPeruPhilippinesPolandPortugalPost-demographic dividendPre-demographic dividendQatarRomaniaRussian FederationRwandaSamoaSao Tome and PrincipeSaudi ArabiaSenegalSeychellesSierra LeoneSingaporeSlovak RepublicSloveniaSmall statesSolomon IslandsSouth AfricaSouth AsiaSouth Asia (IDA & IBRD)SpainSri LankaSt. LuciaSt. Vincent and the GrenadinesSub-Saharan Africa Sub-Saharan Africa (excluding high income)Sub-Saharan Africa (IDA & IBRD countries)SudanSurinameSwazilandSwedenSwitzerlandSyrian Arab RepublicTajikistanTanzaniaThailandTogoTongaTrinidad and TobagoTunisiaTurkeyTurkmenistanUgandaUkraineUnited Arab EmiratesUnited KingdomUnited StatesUpper middle incomeUruguayUzbekistanVanuatuVenezuela, RBVietnamWorldYemen, Rep.ZambiaZimbabwe línea de tiempo (timeline):
En esta escala de tiempo se presenta un gráfico de 1971 y 2015 de Indonesia. Los datos de 1970 están ausentes. El número de observaciones reales por fecha: 45.
Fuente (nombre):
Indicadores del desarrollo mundial
Fuente (organización):
World Bank staff estimates based on sources and methods in World Bank's "The Changing Wealth of Nations: Measuring Sustainable Development in the New Millennium" (2011).
Categorías:
Economy & Growth
Se ha actualizado:
23 abr 2017 año
Los indicadores de los cambios de valor en los últimos años
Mínimo:
76.101
1 ene 1972 año
Máximo:
3.268 mil
1 ene 2013 año
A la fecha de observación
Valor
Cambio absoluto
El cambio con respecto al valor anterior
1 ene 1971 año
77.432
+77.432
0.0%
1 ene 1972 año
76.101
-1.331
-1.72%
1 ene 1973 año
85.539
+9.438
12.4%
1 ene 1974 año
120.537
+34.998
40.91%
1 ene 1975 año
167.454
+46.917
38.92%
1 ene 1976 año
201.397
+33.944
20.27%
1 ene 1977 año
240.465
+39.068
19.4%
1 ene 1978 año
285.4
+44.935
18.69%
1 ene 1979 año
315.388
+29.987
10.51%
1 ene 1980 año
252.703
-62.685
-19.88%
1 ene 1981 año
373.76
+121.058
47.91%
1 ene 1982 año
461.383
+87.623
23.44%
1 ene 1983 año
480.527
+19.144
4.15%
1 ene 1984 año
433.781
-46.746
-9.73%
1 ene 1985 año
419.626
-14.154
-3.26%
1 ene 1986 año
424.489
+4.863
1.16%
1 ene 1987 año
403.006
-21.483
-5.06%
1 ene 1988 año
364.995
-38.011
-9.43%
1 ene 1989 año
435.471
+70.475
19.31%
1 ene 1990 año
479.763
+44.292
10.17%
1 ene 1991 año
521.25
+41.487
8.65%
1 ene 1992 año
522.586
+1.336
0.26%
1 ene 1993 año
572.29
+49.704
9.51%
1 ene 1994 año
717.904
+145.613
25.44%
1 ene 1995 año
804.474
+86.57
12.06%
1 ene 1996 año
902.194
+97.72
12.15%
1 ene 1997 año
996.472
+94.279
10.45%
1 ene 1998 año
931.886
-64.586
-6.48%
1 ene 1999 año
386.924
-544.963
-58.48%
1 ene 2000 año
553.321
+166.398
43.01%
1 ene 2001 año
603.461
+50.14
9.06%
1 ene 2002 año
578.136
-25.325
-4.2%
1 ene 2003 año
699.905
+121.769
21.06%
1 ene 2004 año
908.064
+208.159
29.74%
1 ene 2005 año
959.92
+51.856
5.71%
1 ene 2006 año
1.018 mil
+58.535
6.1%
1 ene 2007 año
1.31 mil
+291.554
28.63%
1 ene 2008 año
1.539 mil
+229.006
17.48%
1 ene 2009 año
1.784 mil
+245.3
15.94%
1 ene 2010 año
1.965 mil
+180.643
10.12%
1 ene 2011 año
2.738 mil
+773.321
39.36%
1 ene 2012 año
3.174 mil
+435.554
15.91%
1 ene 2013 año
3.268 mil
+94.566
2.98%
1 ene 2014 año
3.206 mil
-62.027
-1.9%
1 ene 2015 año
3.121 mil
-85.457
-2.67%
Ranking de los países por los datos estadísticos actuales


Comentarios: