29
/es/
es
AIzaSyAYiBZKx7MnpbEhh9jyipgxe19OcubqV5w
April 1, 2024
186103
Malawi
MWI
true
2
1
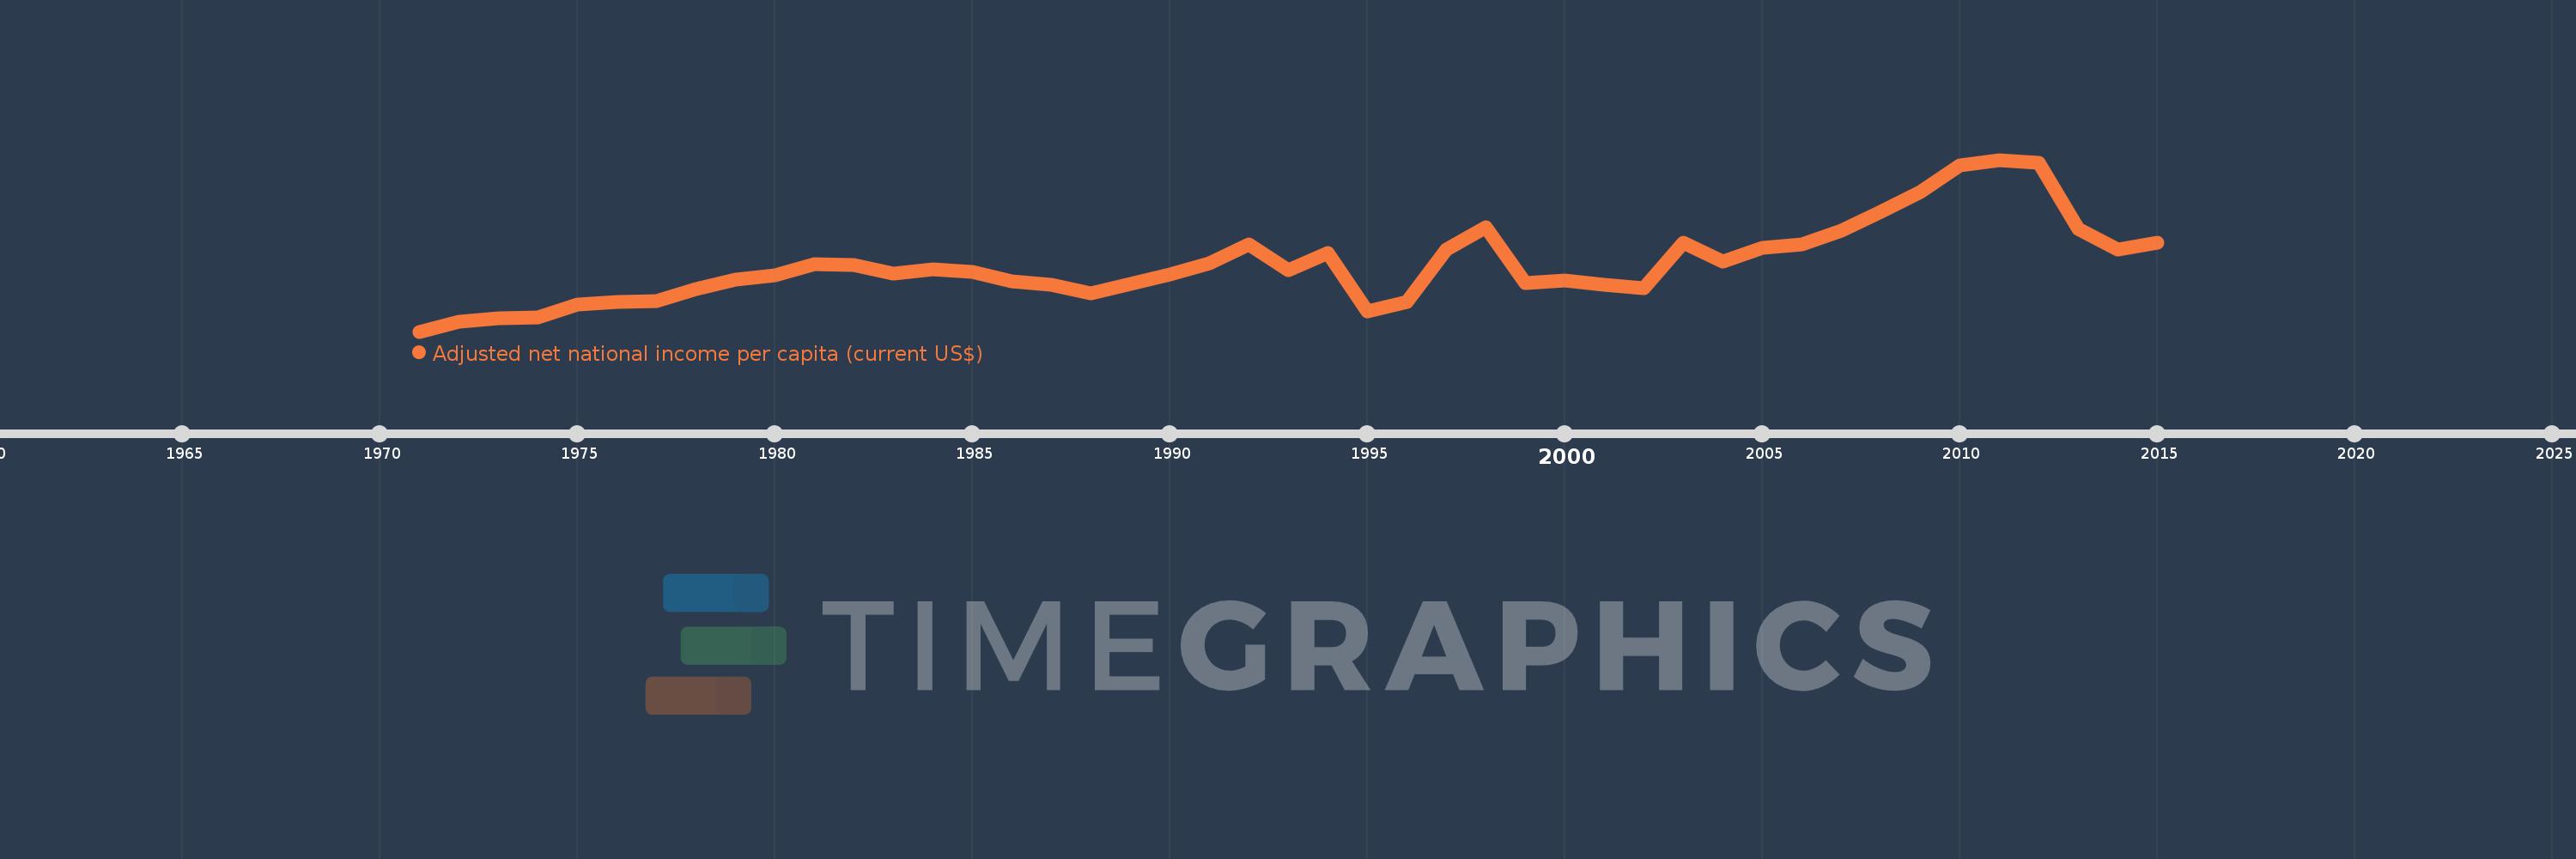
Adjusted net national income per capita (current US$)
2015,2014,2013,2012,2011,2010,2009,2008,2007,2006,2005,2004,2003,2002,2001,2000,1999,1998,1997,1996,1995,1994,1993,1992,1991,1990,1989,1988,1987,1986,1985,1984,1983,1982,1981,1980,1979,1978,1977,1976,1975,1974,1973,1972,1971
Estas estadísticas en otros países:
AfghanistanAlbaniaAlgeriaAngolaArab WorldArgentinaArmeniaAustraliaAustriaAzerbaijanBahamas, TheBahrainBangladeshBarbadosBelarusBelgiumBelizeBeninBhutanBoliviaBotswanaBrazilBrunei DarussalamBulgariaBurkina FasoBurundiCabo VerdeCambodiaCameroonCanadaCaribbean small statesCentral African RepublicCentral Europe and the BalticsChadChileChinaColombiaComorosCongo, Dem. Rep.Congo, Rep.Costa RicaCote d'IvoireCroatiaCubaCyprusCzech RepublicDenmarkDjiboutiDominicaDominican RepublicEarly-demographic dividendEast Asia & PacificEast Asia & Pacific (excluding high income)East Asia & Pacific (IDA & IBRD countries)EcuadorEgypt, Arab Rep.El SalvadorEquatorial GuineaEritreaEstoniaEthiopiaEuro areaEurope & Central AsiaEurope & Central Asia (excluding high income)Europe & Central Asia (IDA & IBRD countries)European UnionFijiFinlandFragile and conflict affected situationsFranceGabonGambia, TheGeorgiaGermanyGhanaGreeceGuatemalaGuineaGuinea-BissauGuyanaHaitiHeavily indebted poor countries (HIPC)High incomeHondurasHong Kong SAR, ChinaHungaryIBRD onlyIcelandIDA & IBRD totalIDA blendIDA onlyIDA totalIndiaIndonesiaIran, Islamic Rep.IraqIrelandIsraelItalyJamaicaJapanJordanKazakhstanKenyaKiribatiKorea, Rep.KuwaitKyrgyz RepublicLao PDRLate-demographic dividendLatin America & Caribbean Latin America & Caribbean (excluding high income)Latin America & the Caribbean (IDA & IBRD countries)LatviaLeast developed countries: UN classificationLebanonLesothoLiberiaLibyaLithuaniaLow & middle incomeLow incomeLower middle incomeLuxembourgMacedonia, FYRMadagascarMalawiMalaysiaMaldivesMaliMauritaniaMauritiusMexicoMiddle East & North AfricaMiddle East & North Africa (excluding high income)Middle East & North Africa (IDA & IBRD countries)Middle incomeMoldovaMongoliaMoroccoMozambiqueMyanmarNamibiaNepalNetherlandsNew ZealandNicaraguaNigerNigeriaNorth AmericaNorwayOECD membersOmanOther small statesPacific island small statesPakistanPanamaPapua New GuineaParaguayPeruPhilippinesPolandPortugalPost-demographic dividendPre-demographic dividendQatarRomaniaRussian FederationRwandaSamoaSao Tome and PrincipeSaudi ArabiaSenegalSeychellesSierra LeoneSingaporeSlovak RepublicSloveniaSmall statesSolomon IslandsSouth AfricaSouth AsiaSouth Asia (IDA & IBRD)SpainSri LankaSt. LuciaSt. Vincent and the GrenadinesSub-Saharan Africa Sub-Saharan Africa (excluding high income)Sub-Saharan Africa (IDA & IBRD countries)SudanSurinameSwazilandSwedenSwitzerlandSyrian Arab RepublicTajikistanTanzaniaThailandTogoTongaTrinidad and TobagoTunisiaTurkeyTurkmenistanUgandaUkraineUnited Arab EmiratesUnited KingdomUnited StatesUpper middle incomeUruguayUzbekistanVanuatuVenezuela, RBVietnamWorldYemen, Rep.ZambiaZimbabwe línea de tiempo (timeline):
En esta escala de tiempo se presenta un gráfico de 1971 y 2015 de Malawi. Los datos de 1970 están ausentes. El número de observaciones reales por fecha: 45.
Fuente (nombre):
Indicadores del desarrollo mundial
Fuente (organización):
World Bank staff estimates based on sources and methods in World Bank's "The Changing Wealth of Nations: Measuring Sustainable Development in the New Millennium" (2011).
Categorías:
Economy & Growth
Se ha actualizado:
23 abr 2017 año
Los indicadores de los cambios de valor en los últimos años
Mínimo:
58.52
1 ene 1971 año
Máximo:
324.958
1 ene 2011 año
A la fecha de observación
Valor
Cambio absoluto
El cambio con respecto al valor anterior
1 ene 1971 año
58.52
+58.52
0.0%
1 ene 1972 año
73.747
+15.227
26.02%
1 ene 1973 año
79.52
+5.773
7.83%
1 ene 1974 año
80.658
+1.138
1.43%
1 ene 1975 año
100.206
+19.549
24.24%
1 ene 1976 año
103.939
+3.733
3.72%
1 ene 1977 año
105.324
+1.385
1.33%
1 ene 1978 año
123.955
+18.631
17.69%
1 ene 1979 año
139.451
+15.496
12.5%
1 ene 1980 año
145.866
+6.416
4.6%
1 ene 1981 año
162.959
+17.093
11.72%
1 ene 1982 año
161.55
-1.409
-0.86%
1 ene 1983 año
148.023
-13.527
-8.37%
1 ene 1984 año
154.918
+6.895
4.66%
1 ene 1985 año
151.645
-3.273
-2.11%
1 ene 1986 año
136.605
-15.04
-9.92%
1 ene 1987 año
130.695
-5.91
-4.33%
1 ene 1988 año
117.4
-13.295
-10.17%
1 ene 1989 año
132.113
+14.713
12.53%
1 ene 1990 año
147.042
+14.928
11.3%
1 ene 1991 año
164.792
+17.75
12.07%
1 ene 1992 año
193.412
+28.62
17.37%
1 ene 1993 año
153.686
-39.726
-20.54%
1 ene 1994 año
180.724
+27.038
17.59%
1 ene 1995 año
89.914
-90.811
-50.25%
1 ene 1996 año
104.186
+14.272
15.87%
1 ene 1997 año
186.265
+82.079
78.78%
1 ene 1998 año
220.934
+34.669
18.61%
1 ene 1999 año
134.31
-86.625
-39.21%
1 ene 2000 año
137.244
+2.934
2.18%
1 ene 2001 año
131.521
-5.723
-4.17%
1 ene 2002 año
125.449
-6.072
-4.62%
1 ene 2003 año
195.945
+70.496
56.19%
1 ene 2004 año
167.327
-28.618
-14.61%
1 ene 2005 año
187.978
+20.651
12.34%
1 ene 2006 año
193.416
+5.438
2.89%
1 ene 2007 año
214.7
+21.284
11.0%
1 ene 2008 año
244.397
+29.698
13.83%
1 ene 2009 año
275.078
+30.68
12.55%
1 ene 2010 año
316.25
+41.173
14.97%
1 ene 2011 año
324.958
+8.708
2.75%
1 ene 2012 año
319.864
-5.095
-1.57%
1 ene 2013 año
218.078
-101.786
-31.82%
1 ene 2014 año
185.576
-32.502
-14.9%
1 ene 2015 año
196.428
+10.852
5.85%
Ranking de los países por los datos estadísticos actuales


Comentarios: