29
/es/
es
AIzaSyAYiBZKx7MnpbEhh9jyipgxe19OcubqV5w
April 1, 2024
55704
Pre-demographic dividend
PRE
false
2
1
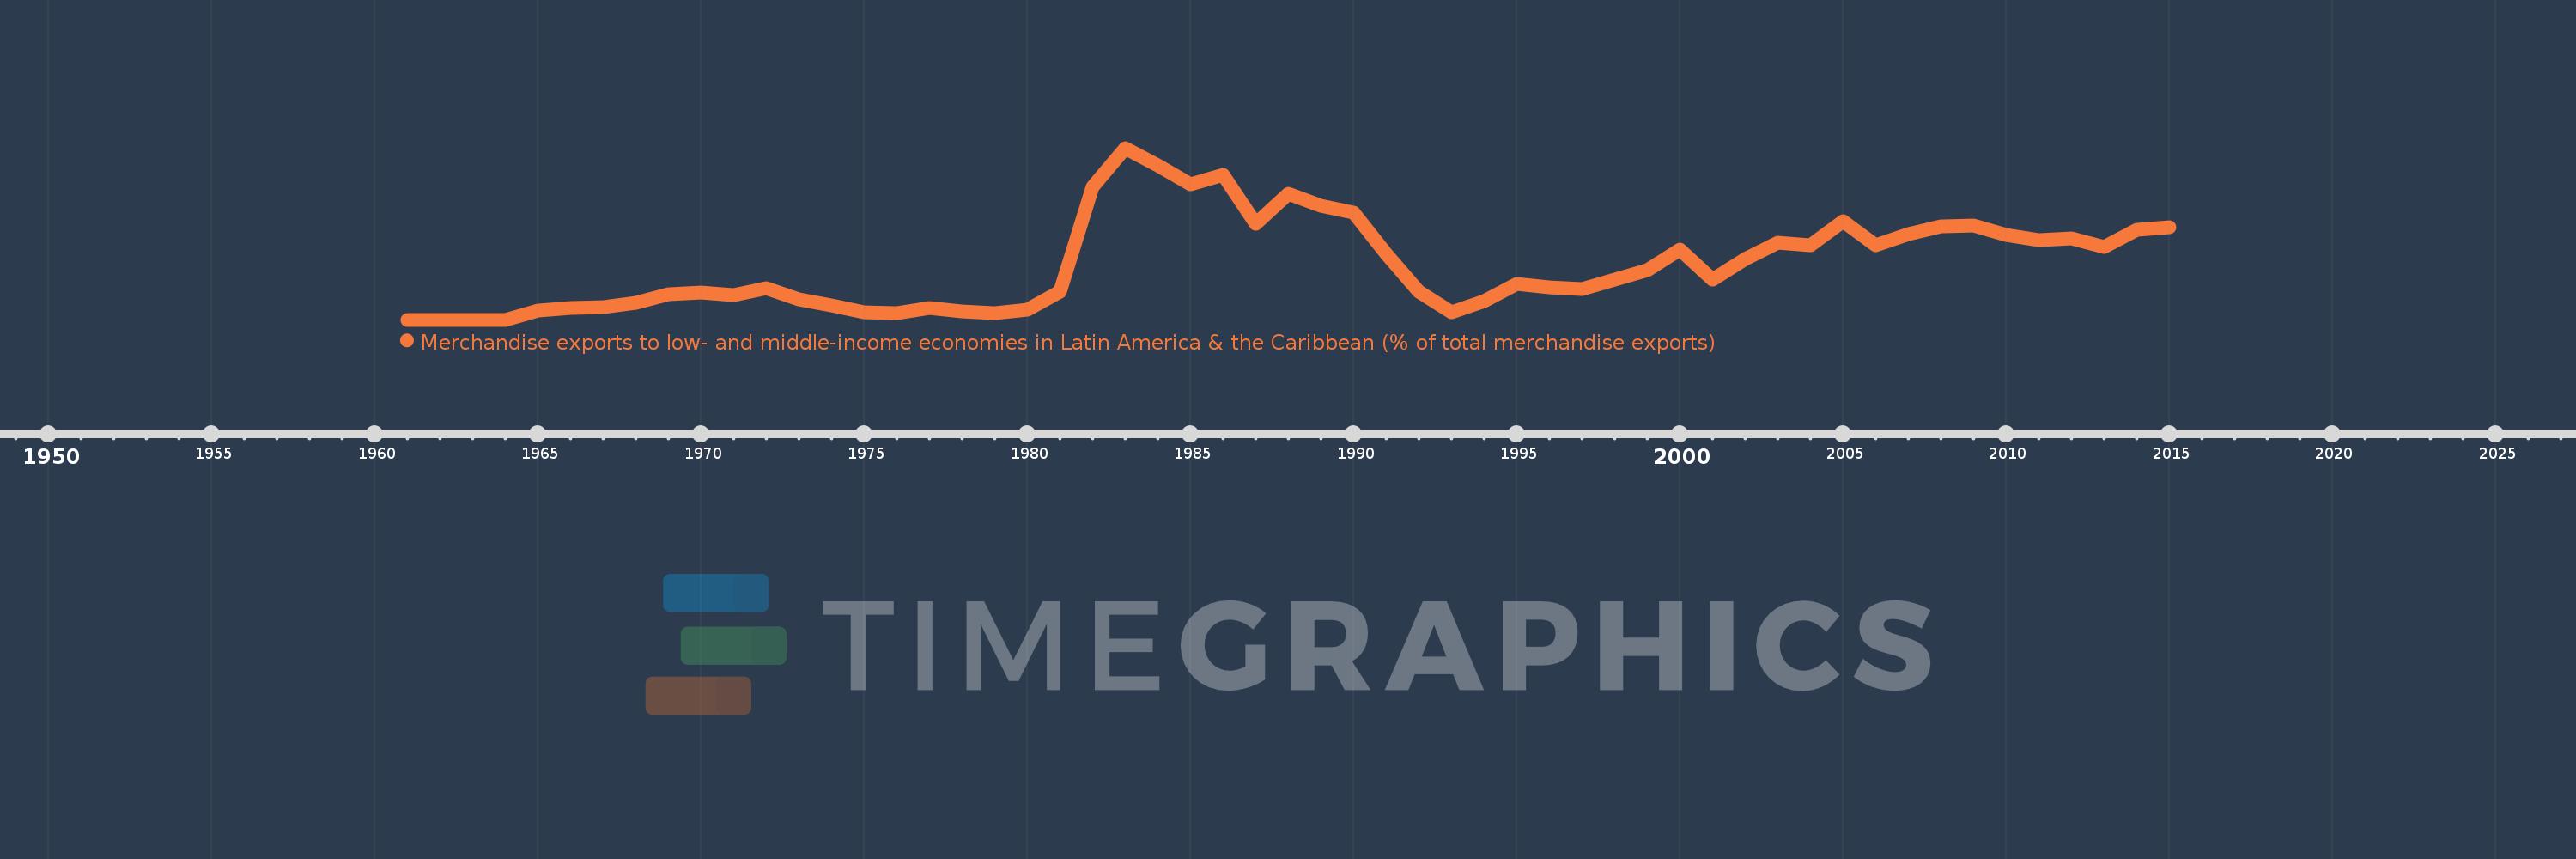
Merchandise exports to low- and middle-income economies in Latin America & the Caribbean (% of total merchandise exports)
2015,2014,2013,2012,2011,2010,2009,2008,2007,2006,2005,2004,2003,2002,2001,2000,1999,1998,1997,1996,1995,1994,1993,1992,1991,1990,1989,1988,1987,1986,1985,1984,1983,1982,1981,1980,1979,1978,1977,1976,1975,1974,1973,1972,1971,1970,1969,1968,1967,1966,1965,1964,1963,1962,1961
Estas estadísticas en otros países:
AfghanistanAlbaniaAlgeriaAngolaAntigua and BarbudaArab WorldArgentinaArmeniaArubaAustraliaAustriaAzerbaijanBahamas, TheBahrainBangladeshBarbadosBelarusBelgiumBelizeBeninBermudaBoliviaBrazilBrunei DarussalamBulgariaBurundiCabo VerdeCambodiaCameroonCanadaCaribbean small statesCentral African RepublicCentral Europe and the BalticsChileChinaColombiaCongo, Dem. Rep.Congo, Rep.Costa RicaCote d'IvoireCroatiaCubaCyprusCzech RepublicDenmarkDominicaDominican RepublicEarly-demographic dividendEast Asia & PacificEast Asia & Pacific (excluding high income)East Asia & Pacific (IDA & IBRD countries)EcuadorEgypt, Arab Rep.El SalvadorEstoniaEthiopiaEuro areaEurope & Central AsiaEurope & Central Asia (excluding high income)Europe & Central Asia (IDA & IBRD countries)European UnionFaroe IslandsFijiFinlandFragile and conflict affected situationsFranceFrench PolynesiaGabonGambia, TheGeorgiaGermanyGhanaGibraltarGreeceGreenlandGrenadaGuatemalaGuineaGuyanaHaitiHeavily indebted poor countries (HIPC)High incomeHondurasHong Kong SAR, ChinaHungaryIBRD onlyIcelandIDA & IBRD totalIDA blendIDA onlyIDA totalIndiaIndonesiaIran, Islamic Rep.IraqIrelandIsraelItalyJamaicaJapanJordanKazakhstanKenyaKorea, Dem. People’s Rep.Korea, Rep.KuwaitLao PDRLate-demographic dividendLatin America & Caribbean Latin America & Caribbean (excluding high income)Latin America & the Caribbean (IDA & IBRD countries)LatviaLeast developed countries: UN classificationLebanonLiberiaLibyaLithuaniaLow & middle incomeLow incomeLower middle incomeLuxembourgMacao SAR, ChinaMacedonia, FYRMadagascarMalawiMalaysiaMaliMaltaMauritaniaMauritiusMexicoMiddle East & North AfricaMiddle East & North Africa (excluding high income)Middle East & North Africa (IDA & IBRD countries)Middle incomeMongoliaMontenegroMoroccoMozambiqueMyanmarNetherlandsNew CaledoniaNew ZealandNicaraguaNigerNigeriaNorth AmericaNorwayOECD membersOmanOther small statesPacific island small statesPakistanPanamaPapua New GuineaParaguayPeruPhilippinesPolandPortugalPost-demographic dividendPre-demographic dividendQatarRomaniaRussian FederationRwandaSamoaSaudi ArabiaSenegalSerbiaSierra LeoneSingaporeSlovak RepublicSloveniaSmall statesSomaliaSouth AfricaSouth AsiaSouth Asia (IDA & IBRD)SpainSri LankaSt. Kitts and NevisSt. LuciaSt. Vincent and the GrenadinesSub-Saharan Africa Sub-Saharan Africa (excluding high income)Sub-Saharan Africa (IDA & IBRD countries)SudanSurinameSwedenSwitzerlandSyrian Arab RepublicTanzaniaThailandTogoTrinidad and TobagoTunisiaTurkeyUgandaUkraineUnited Arab EmiratesUnited KingdomUnited StatesUpper middle incomeUruguayVenezuela, RBVietnamWorldYemen, Rep.ZambiaZimbabwe línea de tiempo (timeline):
En esta escala de tiempo se presenta un gráfico de 1961 y 2015 de Pre-demographic dividend. Los datos de 1960 están ausentes. El número de observaciones reales por fecha: 55.
Fuente (nombre):
Indicadores del desarrollo mundial
Fuente (organización):
World Bank staff estimates based data from International Monetary Fund's Direction of Trade database.
Categorías:
Private Sector, Trade
Se ha actualizado:
23 abr 2017 año
Los indicadores de los cambios de valor en los últimos años
Máximo:
7.332
1 ene 1983 año
A la fecha de observación
Valor
Cambio absoluto
El cambio con respecto al valor anterior
1 ene 1961 año
0.004
+0.004
0.0%
1 ene 1962 año
0.004
0.0
-7.25%
1 ene 1963 año
0.0
-0.004
-100.0%
1 ene 1964 año
0.003
+0.003
%
1 ene 1965 año
0.378
+0.375
13.27 mil%
1 ene 1966 año
0.484
+0.106
28.05%
1 ene 1967 año
0.54
+0.056
11.58%
1 ene 1968 año
0.722
+0.182
33.77%
1 ene 1969 año
1.102
+0.38
52.7%
1 ene 1970 año
1.156
+0.054
4.93%
1 ene 1971 año
1.046
-0.111
-9.56%
1 ene 1972 año
1.346
+0.3
28.73%
1 ene 1973 año
0.863
-0.483
-35.88%
1 ene 1974 año
0.624
-0.239
-27.71%
1 ene 1975 año
0.334
-0.29
-46.53%
1 ene 1976 año
0.269
-0.065
-19.43%
1 ene 1977 año
0.506
+0.237
88.23%
1 ene 1978 año
0.366
-0.14
-27.64%
1 ene 1979 año
0.276
-0.091
-24.73%
1 ene 1980 año
0.425
+0.15
54.27%
1 ene 1981 año
1.215
+0.79
185.87%
1 ene 1982 año
5.67
+4.455
366.51%
1 ene 1983 año
7.332
+1.662
29.31%
1 ene 1984 año
6.602
-0.73
-9.96%
1 ene 1985 año
5.779
-0.823
-12.46%
1 ene 1986 año
6.175
+0.396
6.85%
1 ene 1987 año
4.093
-2.082
-33.72%
1 ene 1988 año
5.36
+1.267
30.95%
1 ene 1989 año
4.872
-0.487
-9.09%
1 ene 1990 año
4.582
-0.29
-5.96%
1 ene 1991 año
2.799
-1.783
-38.91%
1 ene 1992 año
1.215
-1.584
-56.58%
1 ene 1993 año
0.308
-0.907
-74.67%
1 ene 1994 año
0.788
+0.48
155.88%
1 ene 1995 año
1.515
+0.727
92.32%
1 ene 1996 año
1.374
-0.14
-9.27%
1 ene 1997 año
1.306
-0.068
-4.95%
1 ene 1998 año
1.694
+0.388
29.68%
1 ene 1999 año
2.114
+0.419
24.76%
1 ene 2000 año
2.995
+0.882
41.71%
1 ene 2001 año
1.713
-1.282
-42.81%
1 ene 2002 año
2.592
+0.879
51.29%
1 ene 2003 año
3.301
+0.709
27.37%
1 ene 2004 año
3.178
-0.123
-3.72%
1 ene 2005 año
4.191
+1.013
31.87%
1 ene 2006 año
3.178
-1.013
-24.18%
1 ene 2007 año
3.644
+0.467
14.69%
1 ene 2008 año
3.969
+0.325
8.91%
1 ene 2009 año
4.038
+0.068
1.72%
1 ene 2010 año
3.63
-0.407
-10.08%
1 ene 2011 año
3.396
-0.235
-6.47%
1 ene 2012 año
3.485
+0.089
2.63%
1 ene 2013 año
3.108
-0.377
-10.81%
1 ene 2014 año
3.847
+0.738
23.76%
1 ene 2015 año
3.956
+0.109
2.84%
Ranking de los países por los datos estadísticos actuales


Comentarios: