29
/es/
es
AIzaSyAYiBZKx7MnpbEhh9jyipgxe19OcubqV5w
April 1, 2024
208189
Netherlands
NLD
true
2
1
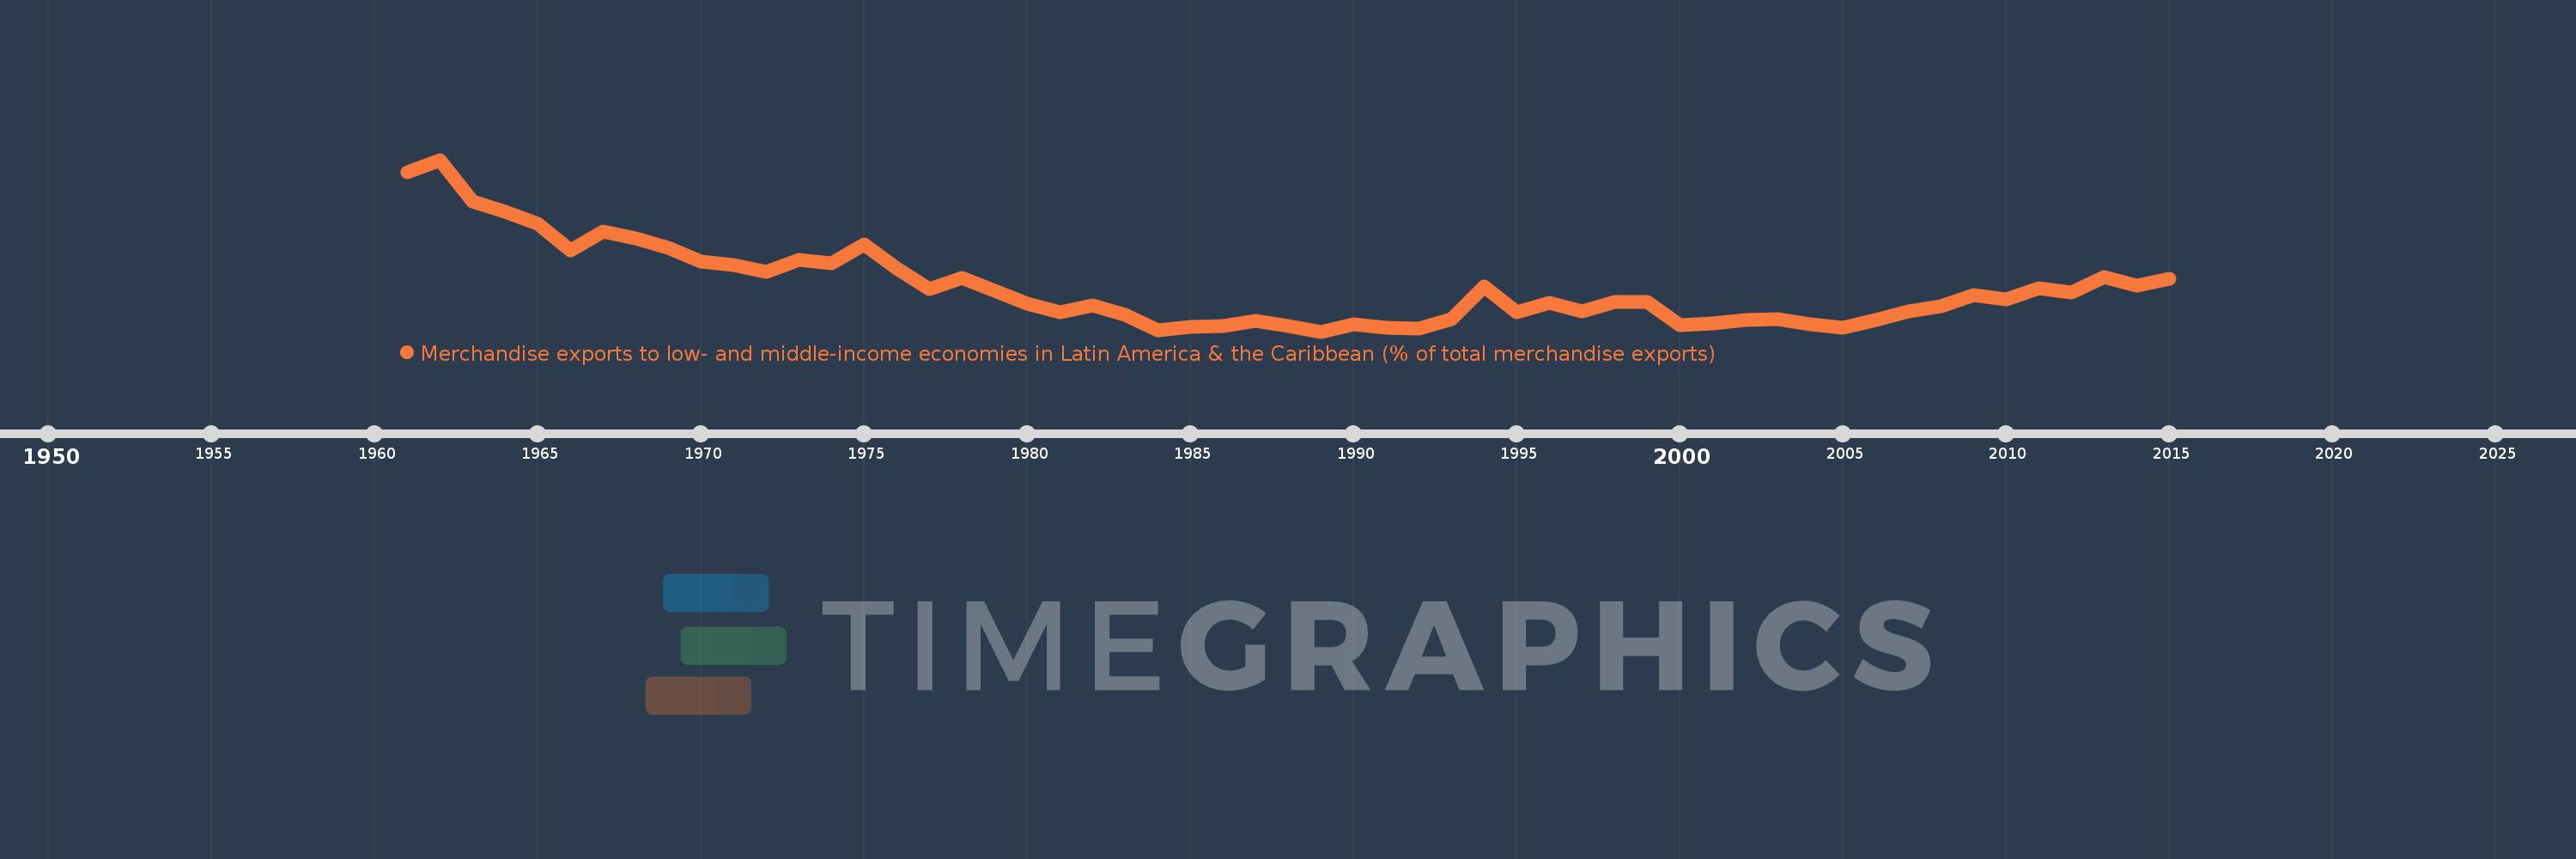
Merchandise exports to low- and middle-income economies in Latin America & the Caribbean (% of total merchandise exports)
2015,2014,2013,2012,2011,2010,2009,2008,2007,2006,2005,2004,2003,2002,2001,2000,1999,1998,1997,1996,1995,1994,1993,1992,1991,1990,1989,1988,1987,1986,1985,1984,1983,1982,1981,1980,1979,1978,1977,1976,1975,1974,1973,1972,1971,1970,1969,1968,1967,1966,1965,1964,1963,1962,1961
Estas estadísticas en otros países:
AfghanistanAlbaniaAlgeriaAngolaAntigua and BarbudaArab WorldArgentinaArmeniaArubaAustraliaAustriaAzerbaijanBahamas, TheBahrainBangladeshBarbadosBelarusBelgiumBelizeBeninBermudaBoliviaBrazilBrunei DarussalamBulgariaBurundiCabo VerdeCambodiaCameroonCanadaCaribbean small statesCentral African RepublicCentral Europe and the BalticsChileChinaColombiaCongo, Dem. Rep.Congo, Rep.Costa RicaCote d'IvoireCroatiaCubaCyprusCzech RepublicDenmarkDominicaDominican RepublicEarly-demographic dividendEast Asia & PacificEast Asia & Pacific (excluding high income)East Asia & Pacific (IDA & IBRD countries)EcuadorEgypt, Arab Rep.El SalvadorEstoniaEthiopiaEuro areaEurope & Central AsiaEurope & Central Asia (excluding high income)Europe & Central Asia (IDA & IBRD countries)European UnionFaroe IslandsFijiFinlandFragile and conflict affected situationsFranceFrench PolynesiaGabonGambia, TheGeorgiaGermanyGhanaGibraltarGreeceGreenlandGrenadaGuatemalaGuineaGuyanaHaitiHeavily indebted poor countries (HIPC)High incomeHondurasHong Kong SAR, ChinaHungaryIBRD onlyIcelandIDA & IBRD totalIDA blendIDA onlyIDA totalIndiaIndonesiaIran, Islamic Rep.IraqIrelandIsraelItalyJamaicaJapanJordanKazakhstanKenyaKorea, Dem. People’s Rep.Korea, Rep.KuwaitLao PDRLate-demographic dividendLatin America & Caribbean Latin America & Caribbean (excluding high income)Latin America & the Caribbean (IDA & IBRD countries)LatviaLeast developed countries: UN classificationLebanonLiberiaLibyaLithuaniaLow & middle incomeLow incomeLower middle incomeLuxembourgMacao SAR, ChinaMacedonia, FYRMadagascarMalawiMalaysiaMaliMaltaMauritaniaMauritiusMexicoMiddle East & North AfricaMiddle East & North Africa (excluding high income)Middle East & North Africa (IDA & IBRD countries)Middle incomeMongoliaMontenegroMoroccoMozambiqueMyanmarNetherlandsNew CaledoniaNew ZealandNicaraguaNigerNigeriaNorth AmericaNorwayOECD membersOmanOther small statesPacific island small statesPakistanPanamaPapua New GuineaParaguayPeruPhilippinesPolandPortugalPost-demographic dividendPre-demographic dividendQatarRomaniaRussian FederationRwandaSamoaSaudi ArabiaSenegalSerbiaSierra LeoneSingaporeSlovak RepublicSloveniaSmall statesSomaliaSouth AfricaSouth AsiaSouth Asia (IDA & IBRD)SpainSri LankaSt. Kitts and NevisSt. LuciaSt. Vincent and the GrenadinesSub-Saharan Africa Sub-Saharan Africa (excluding high income)Sub-Saharan Africa (IDA & IBRD countries)SudanSurinameSwedenSwitzerlandSyrian Arab RepublicTanzaniaThailandTogoTrinidad and TobagoTunisiaTurkeyUgandaUkraineUnited Arab EmiratesUnited KingdomUnited StatesUpper middle incomeUruguayVenezuela, RBVietnamWorldYemen, Rep.ZambiaZimbabwe línea de tiempo (timeline):
En esta escala de tiempo se presenta un gráfico de 1961 y 2015 de Netherlands. Los datos de 1960 están ausentes. El número de observaciones reales por fecha: 55.
Fuente (nombre):
Indicadores del desarrollo mundial
Fuente (organización):
World Bank staff estimates based data from International Monetary Fund's Direction of Trade database.
Categorías:
Private Sector, Trade
Se ha actualizado:
23 abr 2017 año
Los indicadores de los cambios de valor en los últimos años
Mínimo:
0.655
1 ene 1989 año
Máximo:
2.834
1 ene 1962 año
A la fecha de observación
Valor
Cambio absoluto
El cambio con respecto al valor anterior
1 ene 1961 año
2.673
+2.673
0.0%
1 ene 1962 año
2.834
+0.161
6.0%
1 ene 1963 año
2.311
-0.522
-18.43%
1 ene 1964 año
2.175
-0.137
-5.91%
1 ene 1965 año
2.027
-0.148
-6.8%
1 ene 1966 año
1.688
-0.339
-16.71%
1 ene 1967 año
1.92
+0.231
13.71%
1 ene 1968 año
1.833
-0.087
-4.52%
1 ene 1969 año
1.722
-0.111
-6.03%
1 ene 1970 año
1.547
-0.175
-10.18%
1 ene 1971 año
1.497
-0.05
-3.21%
1 ene 1972 año
1.409
-0.089
-5.93%
1 ene 1973 año
1.562
+0.153
10.87%
1 ene 1974 año
1.525
-0.037
-2.37%
1 ene 1975 año
1.761
+0.236
15.47%
1 ene 1976 año
1.453
-0.307
-17.45%
1 ene 1977 año
1.191
-0.262
-18.03%
1 ene 1978 año
1.337
+0.146
12.26%
1 ene 1979 año
1.176
-0.161
-12.03%
1 ene 1980 año
1.011
-0.165
-14.03%
1 ene 1981 año
0.904
-0.108
-10.66%
1 ene 1982 año
0.985
+0.081
8.96%
1 ene 1983 año
0.869
-0.115
-11.72%
1 ene 1984 año
0.668
-0.201
-23.13%
1 ene 1985 año
0.717
+0.049
7.37%
1 ene 1986 año
0.722
+0.004
0.62%
1 ene 1987 año
0.795
+0.074
10.19%
1 ene 1988 año
0.731
-0.065
-8.12%
1 ene 1989 año
0.655
-0.075
-10.3%
1 ene 1990 año
0.747
+0.092
14.04%
1 ene 1991 año
0.708
-0.039
-5.22%
1 ene 1992 año
0.69
-0.018
-2.59%
1 ene 1993 año
0.81
+0.12
17.34%
1 ene 1994 año
1.226
+0.416
51.41%
1 ene 1995 año
0.904
-0.322
-26.3%
1 ene 1996 año
1.02
+0.116
12.83%
1 ene 1997 año
0.911
-0.109
-10.7%
1 ene 1998 año
1.036
+0.126
13.81%
1 ene 1999 año
1.028
-0.008
-0.77%
1 ene 2000 año
0.738
-0.29
-28.22%
1 ene 2001 año
0.754
+0.016
2.14%
1 ene 2002 año
0.798
+0.044
5.82%
1 ene 2003 año
0.816
+0.018
2.31%
1 ene 2004 año
0.752
-0.064
-7.9%
1 ene 2005 año
0.701
-0.05
-6.7%
1 ene 2006 año
0.798
+0.096
13.74%
1 ene 2007 año
0.906
+0.108
13.55%
1 ene 2008 año
0.977
+0.071
7.85%
1 ene 2009 año
1.122
+0.145
14.82%
1 ene 2010 año
1.062
-0.06
-5.3%
1 ene 2011 año
1.208
+0.146
13.74%
1 ene 2012 año
1.15
-0.058
-4.82%
1 ene 2013 año
1.348
+0.197
17.17%
1 ene 2014 año
1.233
-0.114
-8.48%
1 ene 2015 año
1.321
+0.088
7.14%
Ranking de los países por los datos estadísticos actuales


Comentarios: