29
/es/
es
AIzaSyAYiBZKx7MnpbEhh9jyipgxe19OcubqV5w
April 1, 2024
170199
Korea, Rep.
KOR
true
2
1
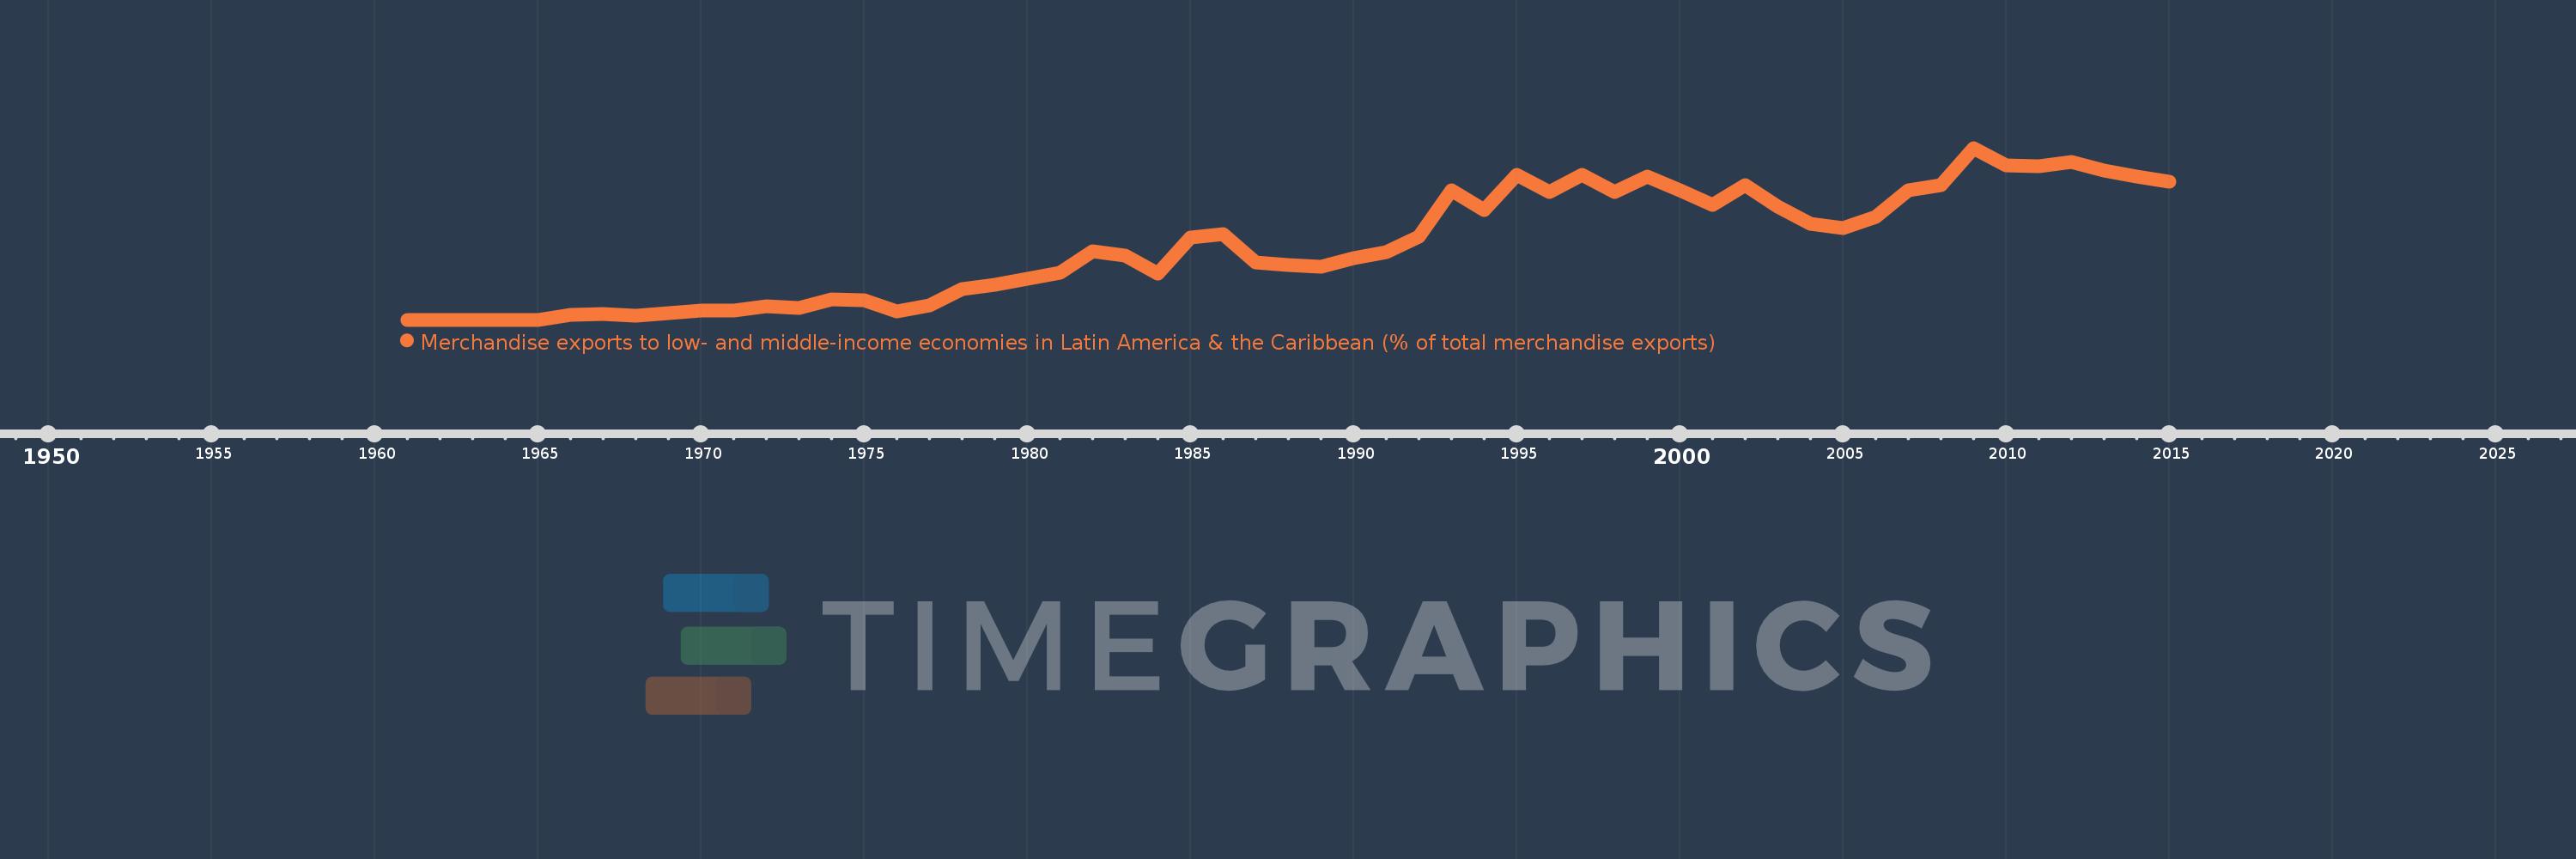
Merchandise exports to low- and middle-income economies in Latin America & the Caribbean (% of total merchandise exports)
2015,2014,2013,2012,2011,2010,2009,2008,2007,2006,2005,2004,2003,2002,2001,2000,1999,1998,1997,1996,1995,1994,1993,1992,1991,1990,1989,1988,1987,1986,1985,1984,1983,1982,1981,1980,1979,1978,1977,1976,1975,1974,1973,1972,1971,1970,1969,1968,1967,1966,1965,1964,1963,1962,1961
Estas estadísticas en otros países:
AfghanistanAlbaniaAlgeriaAngolaAntigua and BarbudaArab WorldArgentinaArmeniaArubaAustraliaAustriaAzerbaijanBahamas, TheBahrainBangladeshBarbadosBelarusBelgiumBelizeBeninBermudaBoliviaBrazilBrunei DarussalamBulgariaBurundiCabo VerdeCambodiaCameroonCanadaCaribbean small statesCentral African RepublicCentral Europe and the BalticsChileChinaColombiaCongo, Dem. Rep.Congo, Rep.Costa RicaCote d'IvoireCroatiaCubaCyprusCzech RepublicDenmarkDominicaDominican RepublicEarly-demographic dividendEast Asia & PacificEast Asia & Pacific (excluding high income)East Asia & Pacific (IDA & IBRD countries)EcuadorEgypt, Arab Rep.El SalvadorEstoniaEthiopiaEuro areaEurope & Central AsiaEurope & Central Asia (excluding high income)Europe & Central Asia (IDA & IBRD countries)European UnionFaroe IslandsFijiFinlandFragile and conflict affected situationsFranceFrench PolynesiaGabonGambia, TheGeorgiaGermanyGhanaGibraltarGreeceGreenlandGrenadaGuatemalaGuineaGuyanaHaitiHeavily indebted poor countries (HIPC)High incomeHondurasHong Kong SAR, ChinaHungaryIBRD onlyIcelandIDA & IBRD totalIDA blendIDA onlyIDA totalIndiaIndonesiaIran, Islamic Rep.IraqIrelandIsraelItalyJamaicaJapanJordanKazakhstanKenyaKorea, Dem. People’s Rep.Korea, Rep.KuwaitLao PDRLate-demographic dividendLatin America & Caribbean Latin America & Caribbean (excluding high income)Latin America & the Caribbean (IDA & IBRD countries)LatviaLeast developed countries: UN classificationLebanonLiberiaLibyaLithuaniaLow & middle incomeLow incomeLower middle incomeLuxembourgMacao SAR, ChinaMacedonia, FYRMadagascarMalawiMalaysiaMaliMaltaMauritaniaMauritiusMexicoMiddle East & North AfricaMiddle East & North Africa (excluding high income)Middle East & North Africa (IDA & IBRD countries)Middle incomeMongoliaMontenegroMoroccoMozambiqueMyanmarNetherlandsNew CaledoniaNew ZealandNicaraguaNigerNigeriaNorth AmericaNorwayOECD membersOmanOther small statesPacific island small statesPakistanPanamaPapua New GuineaParaguayPeruPhilippinesPolandPortugalPost-demographic dividendPre-demographic dividendQatarRomaniaRussian FederationRwandaSamoaSaudi ArabiaSenegalSerbiaSierra LeoneSingaporeSlovak RepublicSloveniaSmall statesSomaliaSouth AfricaSouth AsiaSouth Asia (IDA & IBRD)SpainSri LankaSt. Kitts and NevisSt. LuciaSt. Vincent and the GrenadinesSub-Saharan Africa Sub-Saharan Africa (excluding high income)Sub-Saharan Africa (IDA & IBRD countries)SudanSurinameSwedenSwitzerlandSyrian Arab RepublicTanzaniaThailandTogoTrinidad and TobagoTunisiaTurkeyUgandaUkraineUnited Arab EmiratesUnited KingdomUnited StatesUpper middle incomeUruguayVenezuela, RBVietnamWorldYemen, Rep.ZambiaZimbabwe línea de tiempo (timeline):
En esta escala de tiempo se presenta un gráfico de 1961 y 2015 de Korea, Rep.. Los datos de 1960 están ausentes. El número de observaciones reales por fecha: 55.
Fuente (nombre):
Indicadores del desarrollo mundial
Fuente (organización):
World Bank staff estimates based data from International Monetary Fund's Direction of Trade database.
Categorías:
Private Sector, Trade
Se ha actualizado:
23 abr 2017 año
Los indicadores de los cambios de valor en los últimos años
Máximo:
6.065
1 ene 2009 año
A la fecha de observación
Valor
Cambio absoluto
El cambio con respecto al valor anterior
1 ene 1961 año
0.0
0.0
0.0%
1 ene 1966 año
0.175
+0.175
%
1 ene 1967 año
0.201
+0.026
14.68%
1 ene 1968 año
0.157
-0.044
-22.01%
1 ene 1969 año
0.22
+0.063
40.43%
1 ene 1970 año
0.337
+0.117
53.44%
1 ene 1971 año
0.333
-0.005
-1.41%
1 ene 1972 año
0.484
+0.152
45.65%
1 ene 1973 año
0.43
-0.055
-11.26%
1 ene 1974 año
0.725
+0.295
68.67%
1 ene 1975 año
0.685
-0.04
-5.5%
1 ene 1976 año
0.291
-0.394
-57.51%
1 ene 1977 año
0.519
+0.227
78.11%
1 ene 1978 año
1.069
+0.55
106.14%
1 ene 1979 año
1.246
+0.177
16.56%
1 ene 1980 año
1.46
+0.214
17.17%
1 ene 1981 año
1.66
+0.2
13.72%
1 ene 1982 año
2.431
+0.771
46.45%
1 ene 1983 año
2.268
-0.163
-6.71%
1 ene 1984 año
1.62
-0.648
-28.57%
1 ene 1985 año
2.889
+1.269
78.35%
1 ene 1986 año
3.027
+0.138
4.76%
1 ene 1987 año
2.025
-1.002
-33.09%
1 ene 1988 año
1.93
-0.095
-4.68%
1 ene 1989 año
1.865
-0.065
-3.37%
1 ene 1990 año
2.161
+0.296
15.85%
1 ene 1991 año
2.38
+0.219
10.15%
1 ene 1992 año
2.946
+0.566
23.79%
1 ene 1993 año
4.562
+1.616
54.84%
1 ene 1994 año
3.862
-0.7
-15.34%
1 ene 1995 año
5.126
+1.264
32.73%
1 ene 1996 año
4.497
-0.629
-12.27%
1 ene 1997 año
5.102
+0.606
13.47%
1 ene 1998 año
4.5
-0.603
-11.82%
1 ene 1999 año
5.063
+0.564
12.53%
1 ene 2000 año
4.56
-0.503
-9.94%
1 ene 2001 año
4.058
-0.502
-11.01%
1 ene 2002 año
4.766
+0.709
17.46%
1 ene 2003 año
3.988
-0.778
-16.32%
1 ene 2004 año
3.394
-0.594
-14.9%
1 ene 2005 año
3.241
-0.153
-4.5%
1 ene 2006 año
3.625
+0.383
11.83%
1 ene 2007 año
4.561
+0.937
25.85%
1 ene 2008 año
4.759
+0.197
4.33%
1 ene 2009 año
6.065
+1.306
27.45%
1 ene 2010 año
5.455
-0.61
-10.05%
1 ene 2011 año
5.42
-0.035
-0.65%
1 ene 2012 año
5.568
+0.148
2.72%
1 ene 2013 año
5.262
-0.305
-5.48%
1 ene 2014 año
5.059
-0.203
-3.86%
1 ene 2015 año
4.888
-0.171
-3.39%
Ranking de los países por los datos estadísticos actuales


Comentarios: