29
/es/
es
AIzaSyAYiBZKx7MnpbEhh9jyipgxe19OcubqV5w
April 1, 2024
176665
Lebanon
LBN
true
2
1
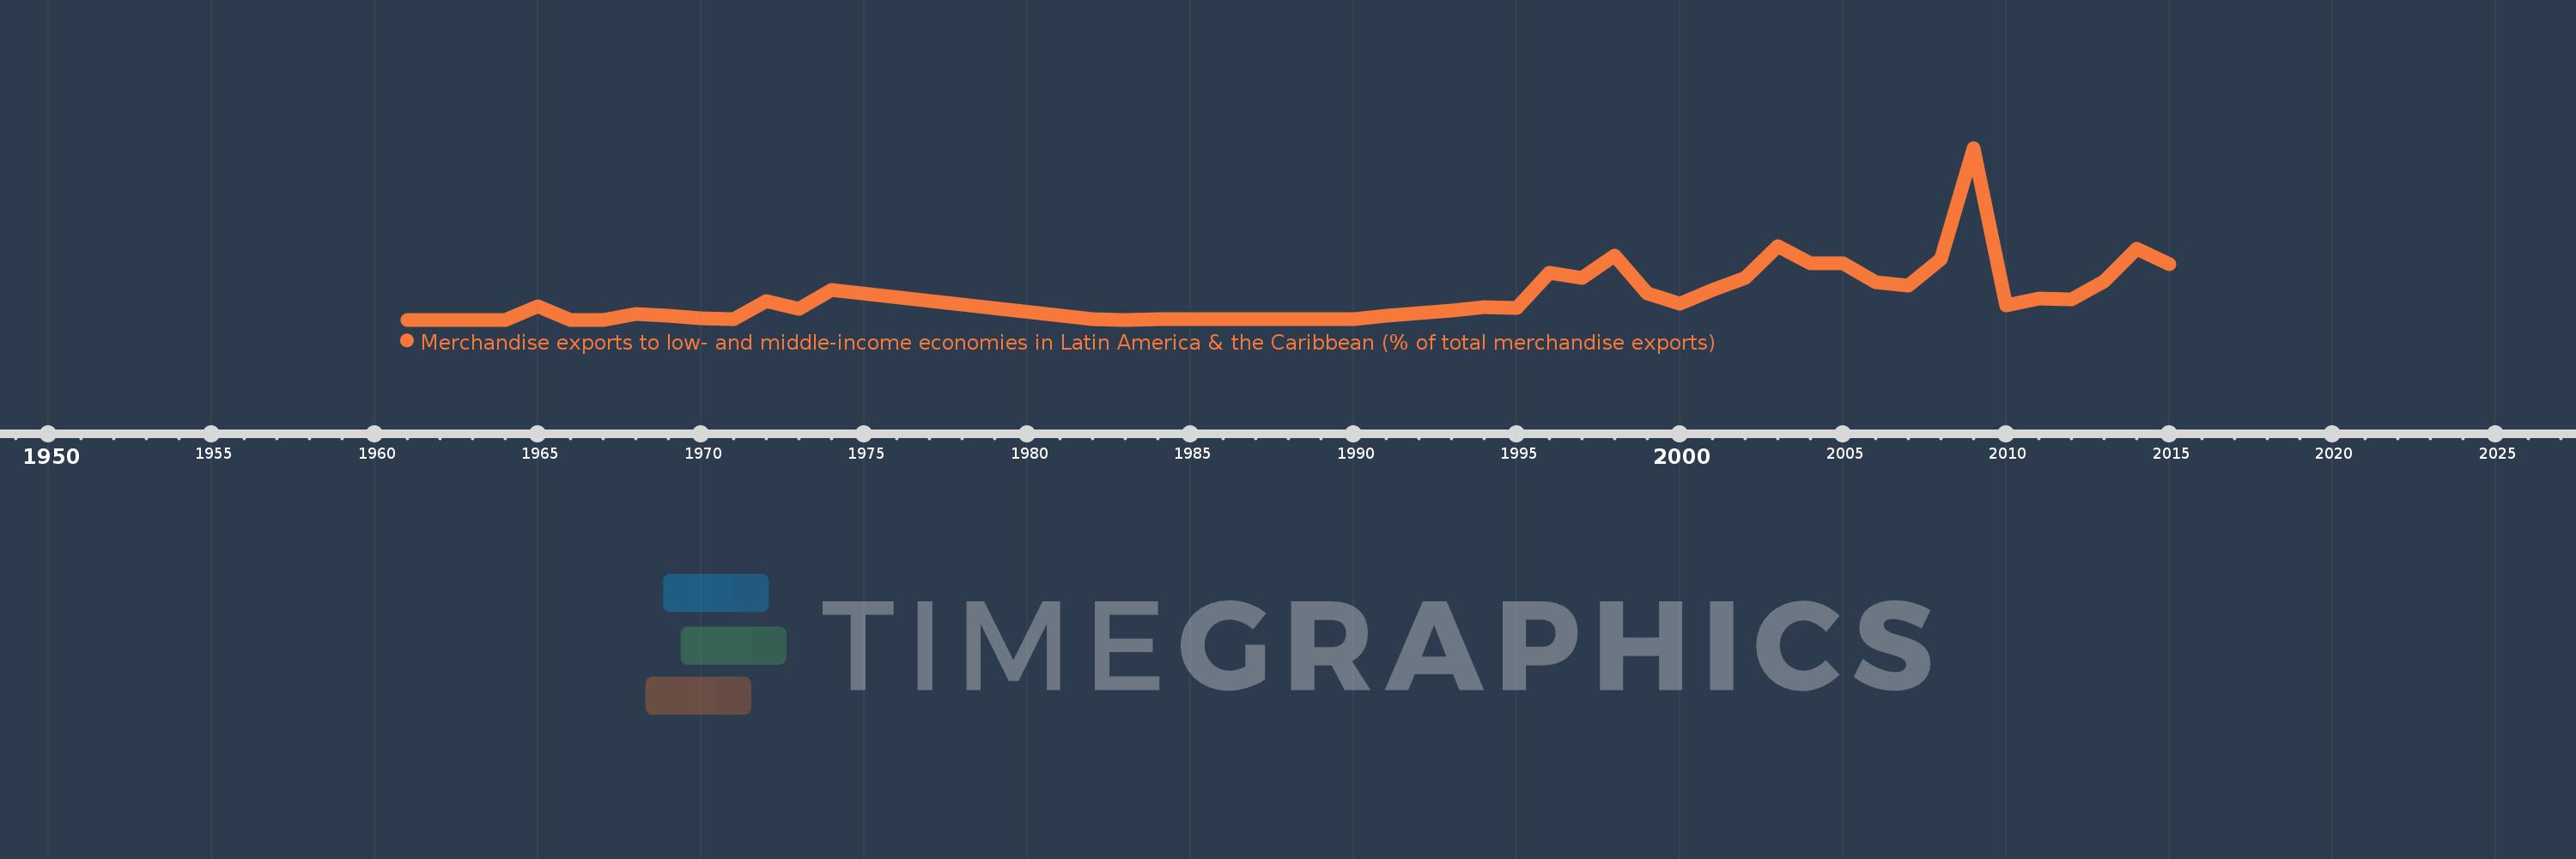
Merchandise exports to low- and middle-income economies in Latin America & the Caribbean (% of total merchandise exports)
2015,2014,2013,2012,2011,2010,2009,2008,2007,2006,2005,2004,2003,2002,2001,2000,1999,1998,1997,1996,1995,1994,1993,1992,1991,1990,1989,1988,1987,1986,1985,1984,1983,1982,1974,1973,1972,1971,1970,1969,1968,1967,1966,1965,1964,1962,1961
Estas estadísticas en otros países:
AfghanistanAlbaniaAlgeriaAngolaAntigua and BarbudaArab WorldArgentinaArmeniaArubaAustraliaAustriaAzerbaijanBahamas, TheBahrainBangladeshBarbadosBelarusBelgiumBelizeBeninBermudaBoliviaBrazilBrunei DarussalamBulgariaBurundiCabo VerdeCambodiaCameroonCanadaCaribbean small statesCentral African RepublicCentral Europe and the BalticsChileChinaColombiaCongo, Dem. Rep.Congo, Rep.Costa RicaCote d'IvoireCroatiaCubaCyprusCzech RepublicDenmarkDominicaDominican RepublicEarly-demographic dividendEast Asia & PacificEast Asia & Pacific (excluding high income)East Asia & Pacific (IDA & IBRD countries)EcuadorEgypt, Arab Rep.El SalvadorEstoniaEthiopiaEuro areaEurope & Central AsiaEurope & Central Asia (excluding high income)Europe & Central Asia (IDA & IBRD countries)European UnionFaroe IslandsFijiFinlandFragile and conflict affected situationsFranceFrench PolynesiaGabonGambia, TheGeorgiaGermanyGhanaGibraltarGreeceGreenlandGrenadaGuatemalaGuineaGuyanaHaitiHeavily indebted poor countries (HIPC)High incomeHondurasHong Kong SAR, ChinaHungaryIBRD onlyIcelandIDA & IBRD totalIDA blendIDA onlyIDA totalIndiaIndonesiaIran, Islamic Rep.IraqIrelandIsraelItalyJamaicaJapanJordanKazakhstanKenyaKorea, Dem. People’s Rep.Korea, Rep.KuwaitLao PDRLate-demographic dividendLatin America & Caribbean Latin America & Caribbean (excluding high income)Latin America & the Caribbean (IDA & IBRD countries)LatviaLeast developed countries: UN classificationLebanonLiberiaLibyaLithuaniaLow & middle incomeLow incomeLower middle incomeLuxembourgMacao SAR, ChinaMacedonia, FYRMadagascarMalawiMalaysiaMaliMaltaMauritaniaMauritiusMexicoMiddle East & North AfricaMiddle East & North Africa (excluding high income)Middle East & North Africa (IDA & IBRD countries)Middle incomeMongoliaMontenegroMoroccoMozambiqueMyanmarNetherlandsNew CaledoniaNew ZealandNicaraguaNigerNigeriaNorth AmericaNorwayOECD membersOmanOther small statesPacific island small statesPakistanPanamaPapua New GuineaParaguayPeruPhilippinesPolandPortugalPost-demographic dividendPre-demographic dividendQatarRomaniaRussian FederationRwandaSamoaSaudi ArabiaSenegalSerbiaSierra LeoneSingaporeSlovak RepublicSloveniaSmall statesSomaliaSouth AfricaSouth AsiaSouth Asia (IDA & IBRD)SpainSri LankaSt. Kitts and NevisSt. LuciaSt. Vincent and the GrenadinesSub-Saharan Africa Sub-Saharan Africa (excluding high income)Sub-Saharan Africa (IDA & IBRD countries)SudanSurinameSwedenSwitzerlandSyrian Arab RepublicTanzaniaThailandTogoTrinidad and TobagoTunisiaTurkeyUgandaUkraineUnited Arab EmiratesUnited KingdomUnited StatesUpper middle incomeUruguayVenezuela, RBVietnamWorldYemen, Rep.ZambiaZimbabwe línea de tiempo (timeline):
En esta escala de tiempo se presenta un gráfico de 1961 y 2015 de Lebanon. Los datos de 1960 están ausentes. El número de observaciones reales por fecha: 47.
Fuente (nombre):
Indicadores del desarrollo mundial
Fuente (organización):
World Bank staff estimates based data from International Monetary Fund's Direction of Trade database.
Categorías:
Private Sector, Trade
Se ha actualizado:
23 abr 2017 año
Los indicadores de los cambios de valor en los últimos años
Máximo:
1.888
1 ene 2009 año
A la fecha de observación
Valor
Cambio absoluto
El cambio con respecto al valor anterior
1 ene 1961 año
0.0
0.0
0.0%
1 ene 1965 año
0.149
+0.149
%
1 ene 1966 año
0.0
-0.149
-100.0%
1 ene 1968 año
0.061
+0.061
%
1 ene 1969 año
0.042
-0.019
-31.12%
1 ene 1970 año
0.012
-0.03
-70.46%
1 ene 1971 año
0.011
-0.002
-12.09%
1 ene 1972 año
0.209
+0.198
1.82 mil%
1 ene 1973 año
0.124
-0.085
-40.61%
1 ene 1974 año
0.329
+0.205
164.83%
1 ene 1982 año
0.005
-0.324
-98.4%
1 ene 1983 año
0.001
-0.004
-78.31%
1 ene 1984 año
0.005
+0.004
346.75%
1 ene 1985 año
0.002
-0.003
-67.03%
1 ene 1986 año
0.009
+0.008
455.75%
1 ene 1987 año
0.002
-0.007
-77.4%
1 ene 1988 año
0.006
+0.004
187.15%
1 ene 1989 año
0.002
-0.004
-66.41%
1 ene 1990 año
0.005
+0.003
170.24%
1 ene 1991 año
0.044
+0.039
705.38%
1 ene 1992 año
0.074
+0.03
67.9%
1 ene 1993 año
0.098
+0.024
32.15%
1 ene 1994 año
0.141
+0.043
43.96%
1 ene 1995 año
0.134
-0.007
-5.09%
1 ene 1996 año
0.517
+0.383
285.88%
1 ene 1997 año
0.463
-0.055
-10.6%
1 ene 1998 año
0.703
+0.24
51.98%
1 ene 1999 año
0.286
-0.417
-59.28%
1 ene 2000 año
0.18
-0.106
-37.01%
1 ene 2001 año
0.329
+0.149
82.63%
1 ene 2002 año
0.463
+0.134
40.67%
1 ene 2003 año
0.813
+0.349
75.44%
1 ene 2004 año
0.619
-0.194
-23.81%
1 ene 2005 año
0.622
+0.003
0.48%
1 ene 2006 año
0.416
-0.206
-33.14%
1 ene 2007 año
0.378
-0.038
-9.19%
1 ene 2008 año
0.668
+0.291
76.91%
1 ene 2009 año
1.888
+1.22
182.5%
1 ene 2010 año
0.158
-1.73
-91.63%
1 ene 2011 año
0.237
+0.079
50.16%
1 ene 2012 año
0.226
-0.011
-4.82%
1 ene 2013 año
0.418
+0.192
85.22%
1 ene 2014 año
0.779
+0.361
86.22%
1 ene 2015 año
0.611
-0.168
-21.56%
Ranking de los países por los datos estadísticos actuales


Comentarios: