29
/es/
es
AIzaSyAYiBZKx7MnpbEhh9jyipgxe19OcubqV5w
April 1, 2024
35938
High income
HIC
false
2
1
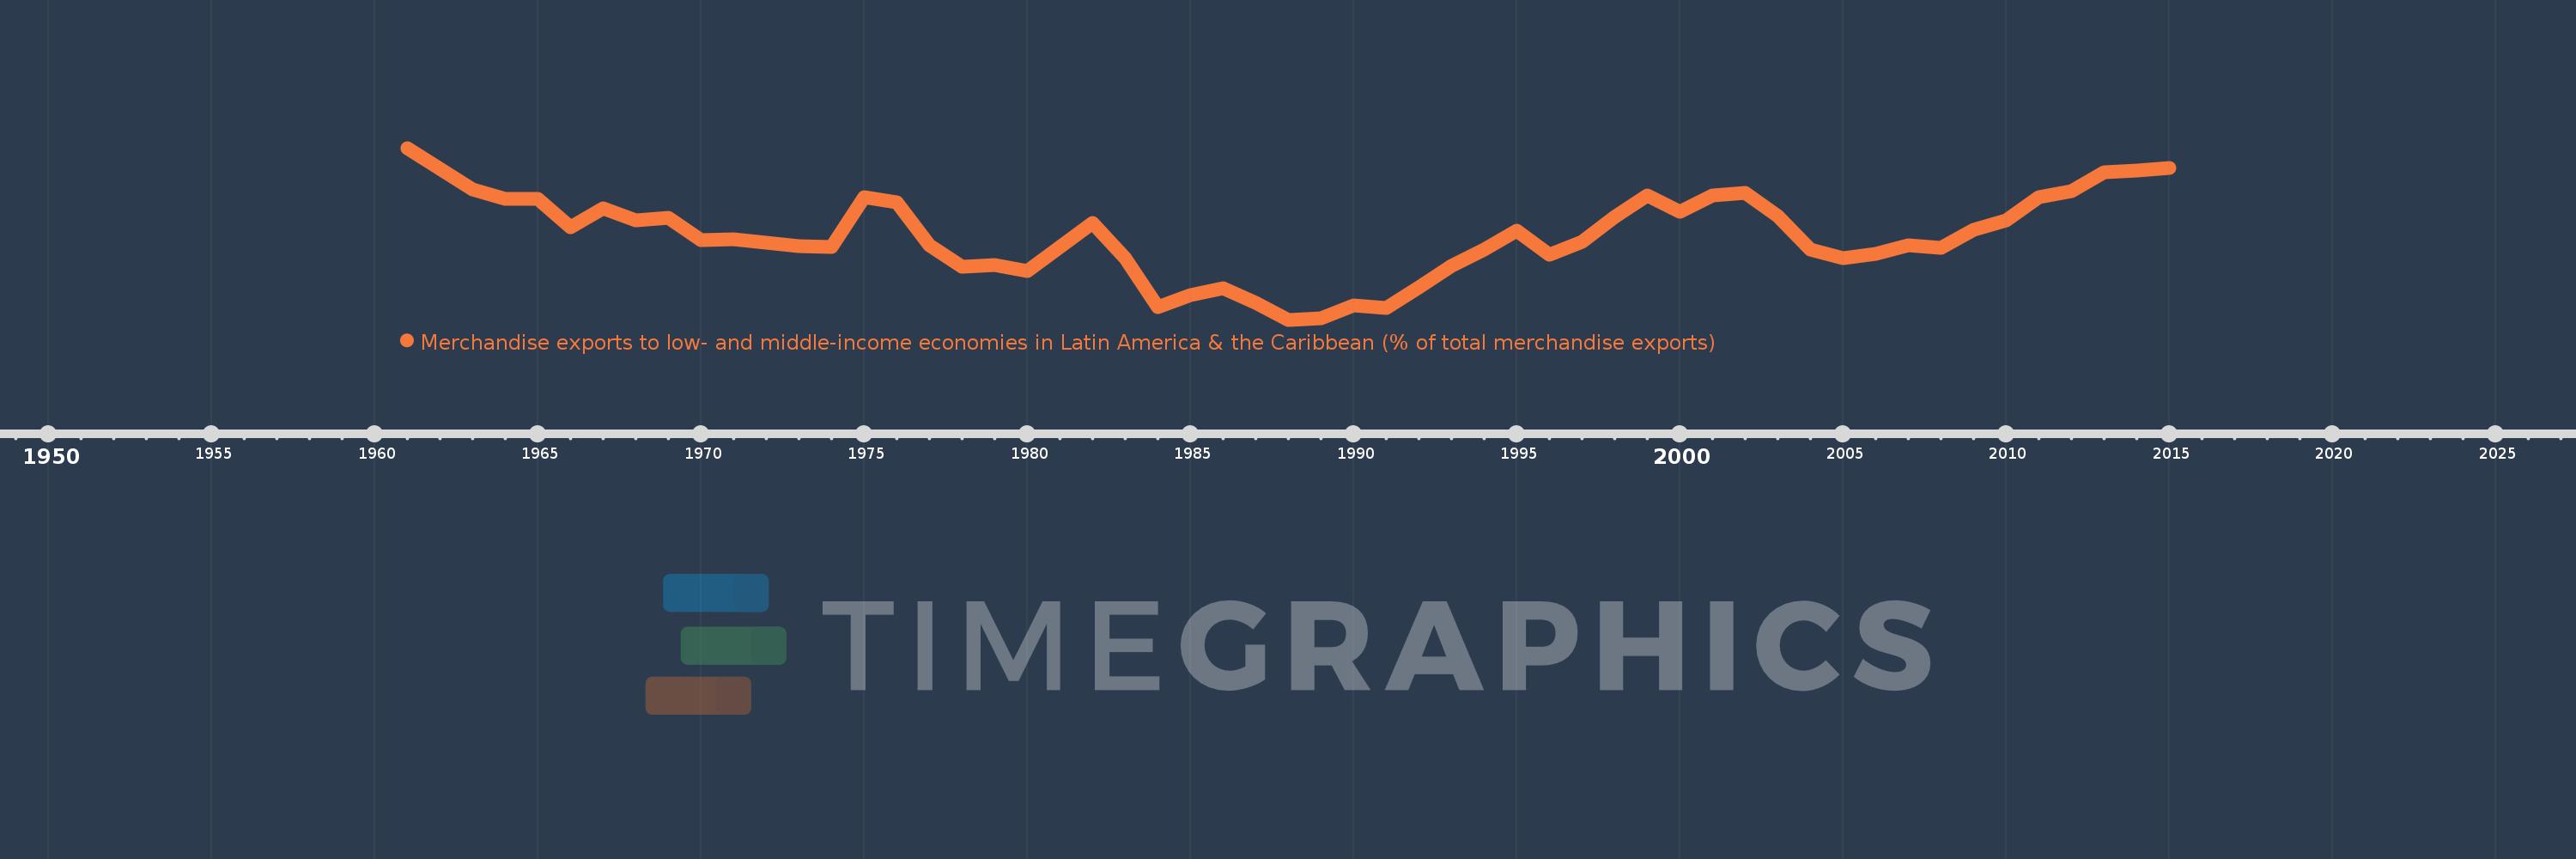
Merchandise exports to low- and middle-income economies in Latin America & the Caribbean (% of total merchandise exports)
2015,2014,2013,2012,2011,2010,2009,2008,2007,2006,2005,2004,2003,2002,2001,2000,1999,1998,1997,1996,1995,1994,1993,1992,1991,1990,1989,1988,1987,1986,1985,1984,1983,1982,1981,1980,1979,1978,1977,1976,1975,1974,1973,1972,1971,1970,1969,1968,1967,1966,1965,1964,1963,1962,1961
Estas estadísticas en otros países:
AfghanistanAlbaniaAlgeriaAngolaAntigua and BarbudaArab WorldArgentinaArmeniaArubaAustraliaAustriaAzerbaijanBahamas, TheBahrainBangladeshBarbadosBelarusBelgiumBelizeBeninBermudaBoliviaBrazilBrunei DarussalamBulgariaBurundiCabo VerdeCambodiaCameroonCanadaCaribbean small statesCentral African RepublicCentral Europe and the BalticsChileChinaColombiaCongo, Dem. Rep.Congo, Rep.Costa RicaCote d'IvoireCroatiaCubaCyprusCzech RepublicDenmarkDominicaDominican RepublicEarly-demographic dividendEast Asia & PacificEast Asia & Pacific (excluding high income)East Asia & Pacific (IDA & IBRD countries)EcuadorEgypt, Arab Rep.El SalvadorEstoniaEthiopiaEuro areaEurope & Central AsiaEurope & Central Asia (excluding high income)Europe & Central Asia (IDA & IBRD countries)European UnionFaroe IslandsFijiFinlandFragile and conflict affected situationsFranceFrench PolynesiaGabonGambia, TheGeorgiaGermanyGhanaGibraltarGreeceGreenlandGrenadaGuatemalaGuineaGuyanaHaitiHeavily indebted poor countries (HIPC)High incomeHondurasHong Kong SAR, ChinaHungaryIBRD onlyIcelandIDA & IBRD totalIDA blendIDA onlyIDA totalIndiaIndonesiaIran, Islamic Rep.IraqIrelandIsraelItalyJamaicaJapanJordanKazakhstanKenyaKorea, Dem. People’s Rep.Korea, Rep.KuwaitLao PDRLate-demographic dividendLatin America & Caribbean Latin America & Caribbean (excluding high income)Latin America & the Caribbean (IDA & IBRD countries)LatviaLeast developed countries: UN classificationLebanonLiberiaLibyaLithuaniaLow & middle incomeLow incomeLower middle incomeLuxembourgMacao SAR, ChinaMacedonia, FYRMadagascarMalawiMalaysiaMaliMaltaMauritaniaMauritiusMexicoMiddle East & North AfricaMiddle East & North Africa (excluding high income)Middle East & North Africa (IDA & IBRD countries)Middle incomeMongoliaMontenegroMoroccoMozambiqueMyanmarNetherlandsNew CaledoniaNew ZealandNicaraguaNigerNigeriaNorth AmericaNorwayOECD membersOmanOther small statesPacific island small statesPakistanPanamaPapua New GuineaParaguayPeruPhilippinesPolandPortugalPost-demographic dividendPre-demographic dividendQatarRomaniaRussian FederationRwandaSamoaSaudi ArabiaSenegalSerbiaSierra LeoneSingaporeSlovak RepublicSloveniaSmall statesSomaliaSouth AfricaSouth AsiaSouth Asia (IDA & IBRD)SpainSri LankaSt. Kitts and NevisSt. LuciaSt. Vincent and the GrenadinesSub-Saharan Africa Sub-Saharan Africa (excluding high income)Sub-Saharan Africa (IDA & IBRD countries)SudanSurinameSwedenSwitzerlandSyrian Arab RepublicTanzaniaThailandTogoTrinidad and TobagoTunisiaTurkeyUgandaUkraineUnited Arab EmiratesUnited KingdomUnited StatesUpper middle incomeUruguayVenezuela, RBVietnamWorldYemen, Rep.ZambiaZimbabwe línea de tiempo (timeline):
En esta escala de tiempo se presenta un gráfico de 1961 y 2015 de High income. Los datos de 1960 están ausentes. El número de observaciones reales por fecha: 55.
Fuente (nombre):
Indicadores del desarrollo mundial
Fuente (organización):
World Bank staff estimates based data from International Monetary Fund's Direction of Trade database.
Categorías:
Private Sector, Trade
Se ha actualizado:
23 abr 2017 año
Los indicadores de los cambios de valor en los últimos años
Mínimo:
2.744
1 ene 1988 año
Máximo:
5.32
1 ene 1961 año
A la fecha de observación
Valor
Cambio absoluto
El cambio con respecto al valor anterior
1 ene 1961 año
5.32
+5.32
0.0%
1 ene 1962 año
5.005
-0.314
-5.91%
1 ene 1963 año
4.693
-0.313
-6.25%
1 ene 1964 año
4.558
-0.135
-2.88%
1 ene 1965 año
4.553
-0.005
-0.1%
1 ene 1966 año
4.133
-0.42
-9.22%
1 ene 1967 año
4.417
+0.284
6.86%
1 ene 1968 año
4.238
-0.179
-4.05%
1 ene 1969 año
4.272
+0.035
0.82%
1 ene 1970 año
3.942
-0.331
-7.74%
1 ene 1971 año
3.952
+0.01
0.26%
1 ene 1972 año
3.898
-0.053
-1.35%
1 ene 1973 año
3.853
-0.046
-1.17%
1 ene 1974 año
3.83
-0.022
-0.58%
1 ene 1975 año
4.581
+0.751
19.59%
1 ene 1976 año
4.502
-0.079
-1.73%
1 ene 1977 año
3.862
-0.64
-14.21%
1 ene 1978 año
3.533
-0.329
-8.52%
1 ene 1979 año
3.563
+0.03
0.84%
1 ene 1980 año
3.477
-0.086
-2.41%
1 ene 1981 año
3.833
+0.356
10.25%
1 ene 1982 año
4.201
+0.368
9.6%
1 ene 1983 año
3.667
-0.534
-12.71%
1 ene 1984 año
2.936
-0.732
-19.95%
1 ene 1985 año
3.11
+0.175
5.95%
1 ene 1986 año
3.216
+0.106
3.41%
1 ene 1987 año
2.996
-0.22
-6.85%
1 ene 1988 año
2.744
-0.252
-8.42%
1 ene 1989 año
2.764
+0.02
0.72%
1 ene 1990 año
2.964
+0.2
7.24%
1 ene 1991 año
2.926
-0.038
-1.27%
1 ene 1992 año
3.23
+0.304
10.39%
1 ene 1993 año
3.555
+0.325
10.06%
1 ene 1994 año
3.799
+0.244
6.86%
1 ene 1995 año
4.086
+0.287
7.57%
1 ene 1996 año
3.717
-0.369
-9.03%
1 ene 1997 año
3.907
+0.189
5.09%
1 ene 1998 año
4.291
+0.384
9.83%
1 ene 1999 año
4.605
+0.315
7.33%
1 ene 2000 año
4.368
-0.237
-5.15%
1 ene 2001 año
4.602
+0.234
5.36%
1 ene 2002 año
4.651
+0.049
1.06%
1 ene 2003 año
4.304
-0.347
-7.45%
1 ene 2004 año
3.793
-0.511
-11.87%
1 ene 2005 año
3.673
-0.121
-3.19%
1 ene 2006 año
3.728
+0.055
1.5%
1 ene 2007 año
3.857
+0.129
3.46%
1 ene 2008 año
3.828
-0.029
-0.74%
1 ene 2009 año
4.088
+0.26
6.79%
1 ene 2010 año
4.234
+0.147
3.59%
1 ene 2011 año
4.584
+0.349
8.25%
1 ene 2012 año
4.667
+0.083
1.82%
1 ene 2013 año
4.958
+0.29
6.22%
1 ene 2014 año
4.976
+0.019
0.37%
1 ene 2015 año
5.017
+0.041
0.82%
Ranking de los países por los datos estadísticos actuales


Comentarios: