29
/es/
es
AIzaSyAYiBZKx7MnpbEhh9jyipgxe19OcubqV5w
April 1, 2024
183129
Macao SAR, China
MAC
true
2
1
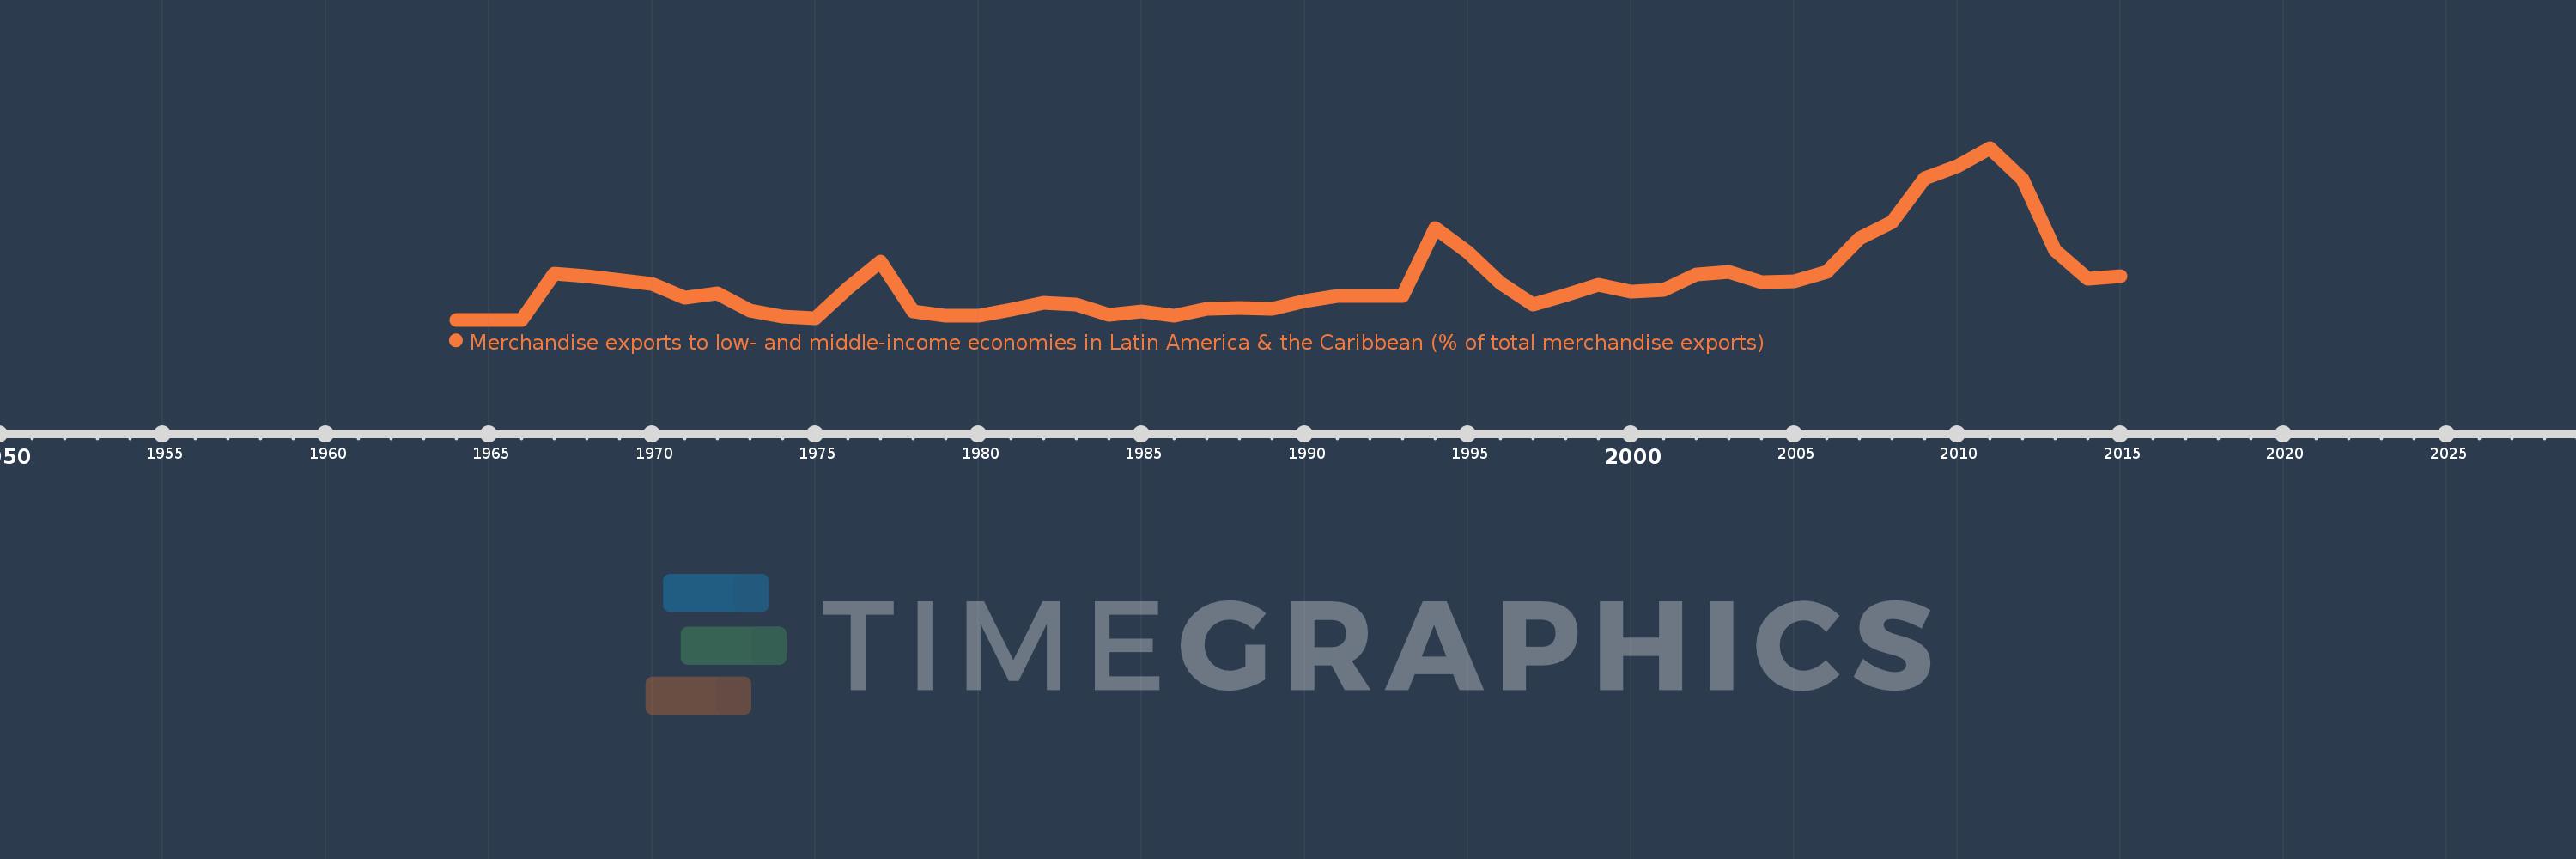
Merchandise exports to low- and middle-income economies in Latin America & the Caribbean (% of total merchandise exports)
2015,2014,2013,2012,2011,2010,2009,2008,2007,2006,2005,2004,2003,2002,2001,2000,1999,1998,1997,1996,1995,1994,1993,1992,1991,1990,1989,1988,1987,1986,1985,1984,1983,1982,1981,1980,1979,1978,1977,1976,1975,1974,1973,1972,1971,1970,1968,1967,1966,1965,1964
Estas estadísticas en otros países:
AfghanistanAlbaniaAlgeriaAngolaAntigua and BarbudaArab WorldArgentinaArmeniaArubaAustraliaAustriaAzerbaijanBahamas, TheBahrainBangladeshBarbadosBelarusBelgiumBelizeBeninBermudaBoliviaBrazilBrunei DarussalamBulgariaBurundiCabo VerdeCambodiaCameroonCanadaCaribbean small statesCentral African RepublicCentral Europe and the BalticsChileChinaColombiaCongo, Dem. Rep.Congo, Rep.Costa RicaCote d'IvoireCroatiaCubaCyprusCzech RepublicDenmarkDominicaDominican RepublicEarly-demographic dividendEast Asia & PacificEast Asia & Pacific (excluding high income)East Asia & Pacific (IDA & IBRD countries)EcuadorEgypt, Arab Rep.El SalvadorEstoniaEthiopiaEuro areaEurope & Central AsiaEurope & Central Asia (excluding high income)Europe & Central Asia (IDA & IBRD countries)European UnionFaroe IslandsFijiFinlandFragile and conflict affected situationsFranceFrench PolynesiaGabonGambia, TheGeorgiaGermanyGhanaGibraltarGreeceGreenlandGrenadaGuatemalaGuineaGuyanaHaitiHeavily indebted poor countries (HIPC)High incomeHondurasHong Kong SAR, ChinaHungaryIBRD onlyIcelandIDA & IBRD totalIDA blendIDA onlyIDA totalIndiaIndonesiaIran, Islamic Rep.IraqIrelandIsraelItalyJamaicaJapanJordanKazakhstanKenyaKorea, Dem. People’s Rep.Korea, Rep.KuwaitLao PDRLate-demographic dividendLatin America & Caribbean Latin America & Caribbean (excluding high income)Latin America & the Caribbean (IDA & IBRD countries)LatviaLeast developed countries: UN classificationLebanonLiberiaLibyaLithuaniaLow & middle incomeLow incomeLower middle incomeLuxembourgMacao SAR, ChinaMacedonia, FYRMadagascarMalawiMalaysiaMaliMaltaMauritaniaMauritiusMexicoMiddle East & North AfricaMiddle East & North Africa (excluding high income)Middle East & North Africa (IDA & IBRD countries)Middle incomeMongoliaMontenegroMoroccoMozambiqueMyanmarNetherlandsNew CaledoniaNew ZealandNicaraguaNigerNigeriaNorth AmericaNorwayOECD membersOmanOther small statesPacific island small statesPakistanPanamaPapua New GuineaParaguayPeruPhilippinesPolandPortugalPost-demographic dividendPre-demographic dividendQatarRomaniaRussian FederationRwandaSamoaSaudi ArabiaSenegalSerbiaSierra LeoneSingaporeSlovak RepublicSloveniaSmall statesSomaliaSouth AfricaSouth AsiaSouth Asia (IDA & IBRD)SpainSri LankaSt. Kitts and NevisSt. LuciaSt. Vincent and the GrenadinesSub-Saharan Africa Sub-Saharan Africa (excluding high income)Sub-Saharan Africa (IDA & IBRD countries)SudanSurinameSwedenSwitzerlandSyrian Arab RepublicTanzaniaThailandTogoTrinidad and TobagoTunisiaTurkeyUgandaUkraineUnited Arab EmiratesUnited KingdomUnited StatesUpper middle incomeUruguayVenezuela, RBVietnamWorldYemen, Rep.ZambiaZimbabwe línea de tiempo (timeline):
En esta escala de tiempo se presenta un gráfico de 1964 y 2015 de Macao SAR, China. Los datos de 1963 están ausentes. El número de observaciones reales por fecha: 51.
Fuente (nombre):
Indicadores del desarrollo mundial
Fuente (organización):
World Bank staff estimates based data from International Monetary Fund's Direction of Trade database.
Categorías:
Private Sector, Trade
Se ha actualizado:
23 abr 2017 año
Los indicadores de los cambios de valor en los últimos años
Máximo:
1.578
1 ene 2011 año
A la fecha de observación
Valor
Cambio absoluto
El cambio con respecto al valor anterior
1 ene 1964 año
0.0
0.0
0.0%
1 ene 1967 año
0.42
+0.42
%
1 ene 1968 año
0.4
-0.02
-4.8%
1 ene 1970 año
0.326
-0.074
-18.58%
1 ene 1971 año
0.203
-0.123
-37.76%
1 ene 1972 año
0.245
+0.043
21.09%
1 ene 1973 año
0.085
-0.16
-65.29%
1 ene 1974 año
0.031
-0.055
-64.05%
1 ene 1975 año
0.017
-0.014
-44.37%
1 ene 1976 año
0.292
+0.275
1.62 mil%
1 ene 1977 año
0.534
+0.241
82.49%
1 ene 1978 año
0.08
-0.454
-85.05%
1 ene 1979 año
0.039
-0.041
-51.04%
1 ene 1980 año
0.034
-0.005
-11.9%
1 ene 1981 año
0.093
+0.058
169.89%
1 ene 1982 año
0.159
+0.066
71.48%
1 ene 1983 año
0.14
-0.019
-11.83%
1 ene 1984 año
0.048
-0.092
-65.83%
1 ene 1985 año
0.079
+0.031
64.45%
1 ene 1986 año
0.038
-0.041
-51.49%
1 ene 1987 año
0.101
+0.063
164.08%
1 ene 1988 año
0.11
+0.009
8.69%
1 ene 1989 año
0.104
-0.006
-5.22%
1 ene 1990 año
0.17
+0.066
63.57%
1 ene 1991 año
0.215
+0.045
26.33%
1 ene 1992 año
0.222
+0.007
3.31%
1 ene 1993 año
0.217
-0.005
-2.25%
1 ene 1994 año
0.844
+0.627
288.65%
1 ene 1995 año
0.624
-0.221
-26.13%
1 ene 1996 año
0.338
-0.286
-45.8%
1 ene 1997 año
0.143
-0.195
-57.7%
1 ene 1998 año
0.227
+0.084
58.91%
1 ene 1999 año
0.323
+0.096
42.26%
1 ene 2000 año
0.255
-0.069
-21.19%
1 ene 2001 año
0.274
+0.02
7.7%
1 ene 2002 año
0.412
+0.138
50.28%
1 ene 2003 año
0.439
+0.027
6.52%
1 ene 2004 año
0.344
-0.095
-21.57%
1 ene 2005 año
0.353
+0.009
2.58%
1 ene 2006 año
0.442
+0.088
24.98%
1 ene 2007 año
0.747
+0.305
69.1%
1 ene 2008 año
0.901
+0.154
20.63%
1 ene 2009 año
1.303
+0.403
44.68%
1 ene 2010 año
1.406
+0.103
7.89%
1 ene 2011 año
1.578
+0.171
12.18%
1 ene 2012 año
1.295
-0.283
-17.94%
1 ene 2013 año
0.636
-0.658
-50.86%
1 ene 2014 año
0.378
-0.258
-40.52%
1 ene 2015 año
0.403
+0.025
6.57%
Ranking de los países por los datos estadísticos actuales


Comentarios: