29
/es/
es
AIzaSyAYiBZKx7MnpbEhh9jyipgxe19OcubqV5w
April 1, 2024
286164
Zambia
ZMB
true
2
1
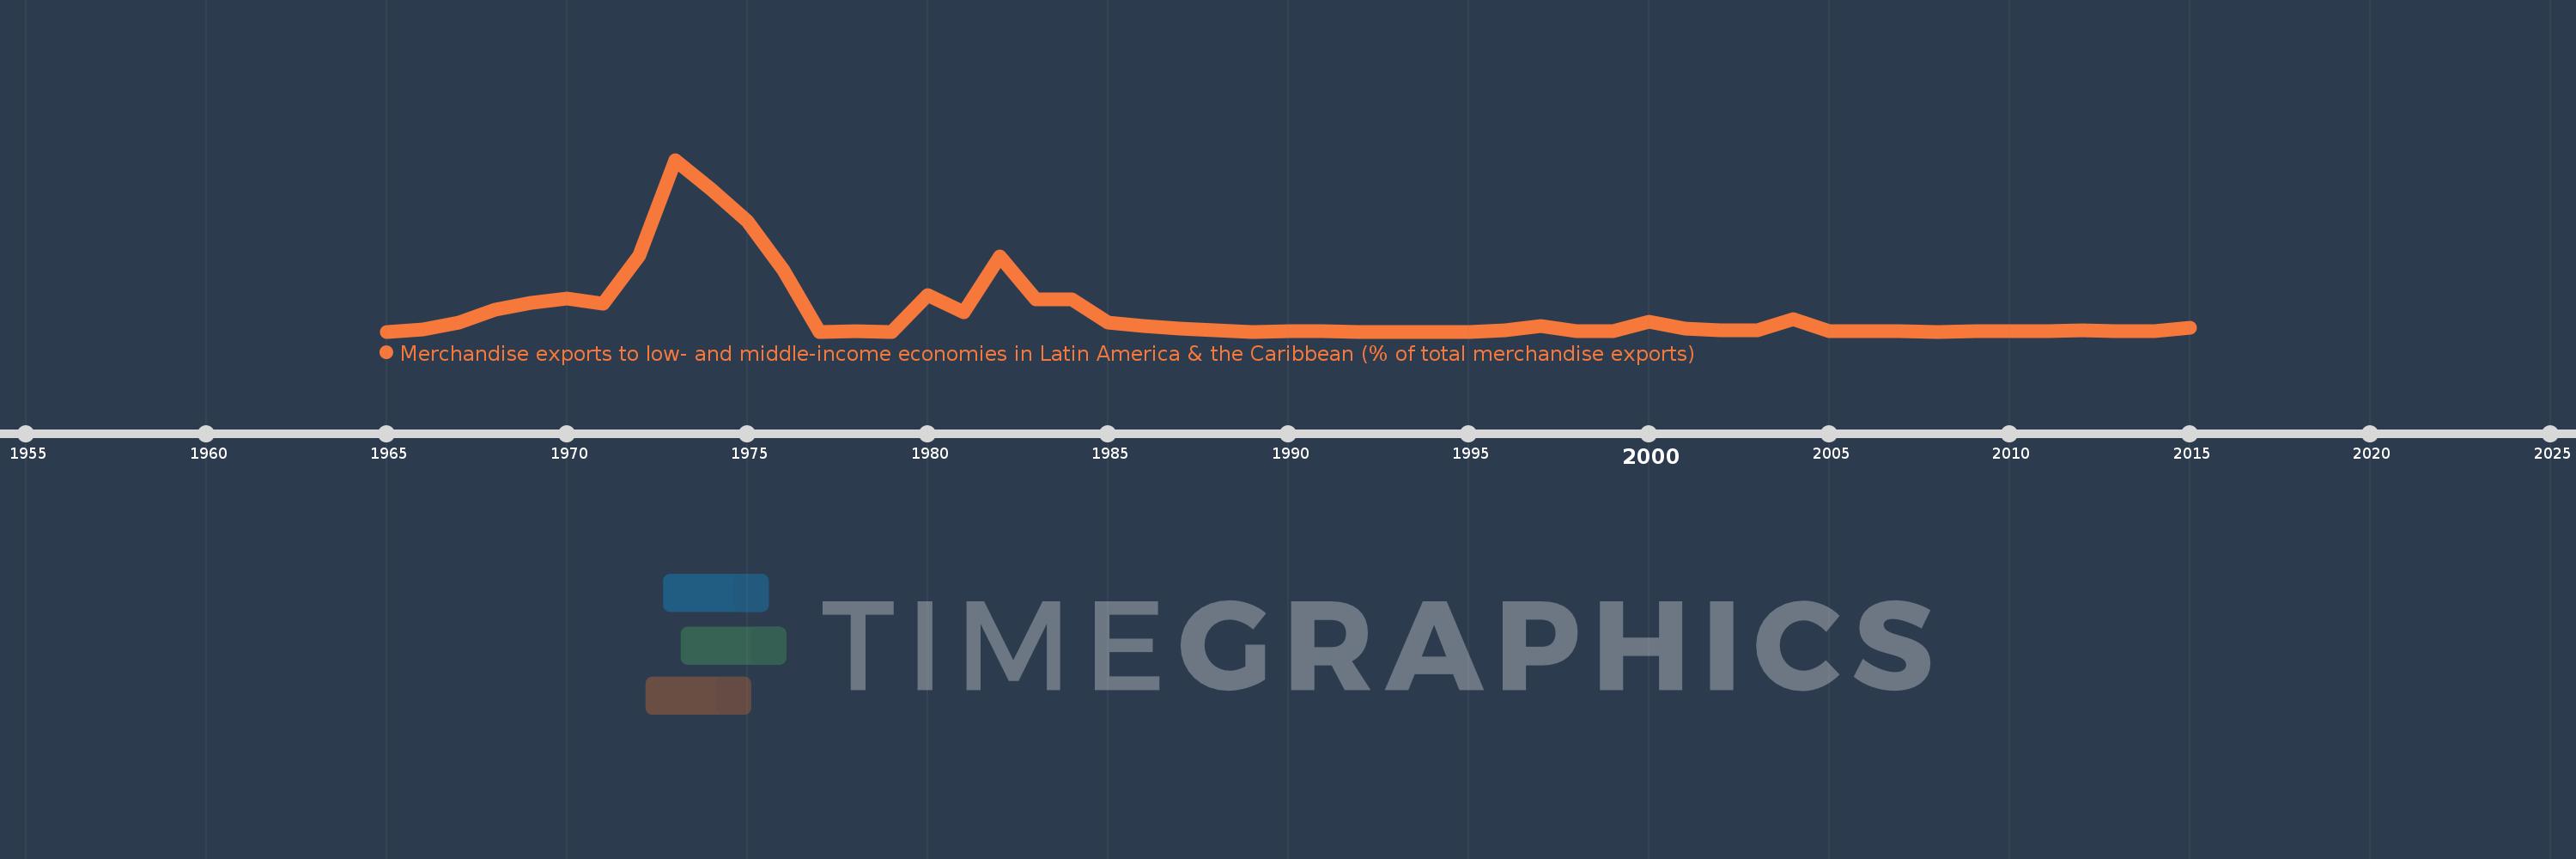
Merchandise exports to low- and middle-income economies in Latin America & the Caribbean (% of total merchandise exports)
2015,2014,2013,2012,2011,2010,2009,2008,2007,2006,2005,2004,2003,2002,2001,2000,1999,1998,1997,1996,1995,1994,1993,1992,1991,1990,1989,1988,1987,1986,1985,1984,1983,1982,1981,1980,1979,1978,1977,1976,1975,1974,1973,1972,1971,1970,1969,1968,1967,1966,1965
Estas estadísticas en otros países:
AfghanistanAlbaniaAlgeriaAngolaAntigua and BarbudaArab WorldArgentinaArmeniaArubaAustraliaAustriaAzerbaijanBahamas, TheBahrainBangladeshBarbadosBelarusBelgiumBelizeBeninBermudaBoliviaBrazilBrunei DarussalamBulgariaBurundiCabo VerdeCambodiaCameroonCanadaCaribbean small statesCentral African RepublicCentral Europe and the BalticsChileChinaColombiaCongo, Dem. Rep.Congo, Rep.Costa RicaCote d'IvoireCroatiaCubaCyprusCzech RepublicDenmarkDominicaDominican RepublicEarly-demographic dividendEast Asia & PacificEast Asia & Pacific (excluding high income)East Asia & Pacific (IDA & IBRD countries)EcuadorEgypt, Arab Rep.El SalvadorEstoniaEthiopiaEuro areaEurope & Central AsiaEurope & Central Asia (excluding high income)Europe & Central Asia (IDA & IBRD countries)European UnionFaroe IslandsFijiFinlandFragile and conflict affected situationsFranceFrench PolynesiaGabonGambia, TheGeorgiaGermanyGhanaGibraltarGreeceGreenlandGrenadaGuatemalaGuineaGuyanaHaitiHeavily indebted poor countries (HIPC)High incomeHondurasHong Kong SAR, ChinaHungaryIBRD onlyIcelandIDA & IBRD totalIDA blendIDA onlyIDA totalIndiaIndonesiaIran, Islamic Rep.IraqIrelandIsraelItalyJamaicaJapanJordanKazakhstanKenyaKorea, Dem. People’s Rep.Korea, Rep.KuwaitLao PDRLate-demographic dividendLatin America & Caribbean Latin America & Caribbean (excluding high income)Latin America & the Caribbean (IDA & IBRD countries)LatviaLeast developed countries: UN classificationLebanonLiberiaLibyaLithuaniaLow & middle incomeLow incomeLower middle incomeLuxembourgMacao SAR, ChinaMacedonia, FYRMadagascarMalawiMalaysiaMaliMaltaMauritaniaMauritiusMexicoMiddle East & North AfricaMiddle East & North Africa (excluding high income)Middle East & North Africa (IDA & IBRD countries)Middle incomeMongoliaMontenegroMoroccoMozambiqueMyanmarNetherlandsNew CaledoniaNew ZealandNicaraguaNigerNigeriaNorth AmericaNorwayOECD membersOmanOther small statesPacific island small statesPakistanPanamaPapua New GuineaParaguayPeruPhilippinesPolandPortugalPost-demographic dividendPre-demographic dividendQatarRomaniaRussian FederationRwandaSamoaSaudi ArabiaSenegalSerbiaSierra LeoneSingaporeSlovak RepublicSloveniaSmall statesSomaliaSouth AfricaSouth AsiaSouth Asia (IDA & IBRD)SpainSri LankaSt. Kitts and NevisSt. LuciaSt. Vincent and the GrenadinesSub-Saharan Africa Sub-Saharan Africa (excluding high income)Sub-Saharan Africa (IDA & IBRD countries)SudanSurinameSwedenSwitzerlandSyrian Arab RepublicTanzaniaThailandTogoTrinidad and TobagoTunisiaTurkeyUgandaUkraineUnited Arab EmiratesUnited KingdomUnited StatesUpper middle incomeUruguayVenezuela, RBVietnamWorldYemen, Rep.ZambiaZimbabwe línea de tiempo (timeline):
En esta escala de tiempo se presenta un gráfico de 1965 y 2015 de Zambia. Los datos de 1964 están ausentes. El número de observaciones reales por fecha: 51.
Fuente (nombre):
Indicadores del desarrollo mundial
Fuente (organización):
World Bank staff estimates based data from International Monetary Fund's Direction of Trade database.
Categorías:
Private Sector, Trade
Se ha actualizado:
23 abr 2017 año
Los indicadores de los cambios de valor en los últimos años
Máximo:
6.187
1 ene 1973 año
A la fecha de observación
Valor
Cambio absoluto
El cambio con respecto al valor anterior
1 ene 1965 año
0.0
0.0
0.0%
1 ene 1966 año
0.075
+0.075
%
1 ene 1967 año
0.319
+0.244
323.78%
1 ene 1968 año
0.798
+0.479
150.35%
1 ene 1969 año
1.025
+0.227
28.49%
1 ene 1970 año
1.176
+0.15
14.68%
1 ene 1971 año
0.993
-0.183
-15.57%
1 ene 1972 año
2.751
+1.759
177.15%
1 ene 1973 año
6.187
+3.435
124.85%
1 ene 1974 año
5.111
-1.076
-17.39%
1 ene 1975 año
3.96
-1.151
-22.52%
1 ene 1976 año
2.226
-1.734
-43.78%
1 ene 1977 año
0.0
-2.226
-100.0%
1 ene 1978 año
0.001
+0.001
%
1 ene 1979 año
0.0
-0.001
-100.0%
1 ene 1980 año
1.305
+1.305
%
1 ene 1981 año
0.697
-0.608
-46.6%
1 ene 1982 año
2.697
+2.0
286.84%
1 ene 1983 año
1.169
-1.528
-56.67%
1 ene 1984 año
1.169
0.0
0.0%
1 ene 1985 año
0.34
-0.828
-70.88%
1 ene 1986 año
0.206
-0.135
-39.57%
1 ene 1987 año
0.116
-0.09
-43.58%
1 ene 1988 año
0.041
-0.075
-64.98%
1 ene 1989 año
0.0
-0.04
-99.42%
1 ene 1990 año
0.017
+0.017
7.26 mil%
1 ene 1991 año
0.015
-0.002
-14.2%
1 ene 1992 año
0.0
-0.015
-100.0%
1 ene 1996 año
0.033
+0.033
%
1 ene 1997 año
0.211
+0.178
546.41%
1 ene 1998 año
0.006
-0.205
-97.23%
1 ene 1999 año
0.026
+0.02
341.82%
1 ene 2000 año
0.342
+0.316
1.23 mil%
1 ene 2001 año
0.108
-0.234
-68.5%
1 ene 2002 año
0.046
-0.062
-57.54%
1 ene 2003 año
0.055
+0.009
19.39%
1 ene 2004 año
0.434
+0.38
695.63%
1 ene 2005 año
0.015
-0.419
-96.52%
1 ene 2006 año
0.003
-0.012
-78.13%
1 ene 2007 año
0.002
-0.002
-49.74%
1 ene 2008 año
0.0
-0.001
-76.43%
1 ene 2009 año
0.003
+0.003
668.86%
1 ene 2010 año
0.019
+0.016
518.35%
1 ene 2011 año
0.005
-0.013
-70.76%
1 ene 2012 año
0.036
+0.03
556.94%
1 ene 2013 año
0.012
-0.023
-65.26%
1 ene 2014 año
0.019
+0.007
52.81%
1 ene 2015 año
0.143
+0.124
654.87%
Ranking de los países por los datos estadísticos actuales


Comentarios: