29
/es/
es
AIzaSyAYiBZKx7MnpbEhh9jyipgxe19OcubqV5w
April 1, 2024
105140
Chile
CHL
true
2
1
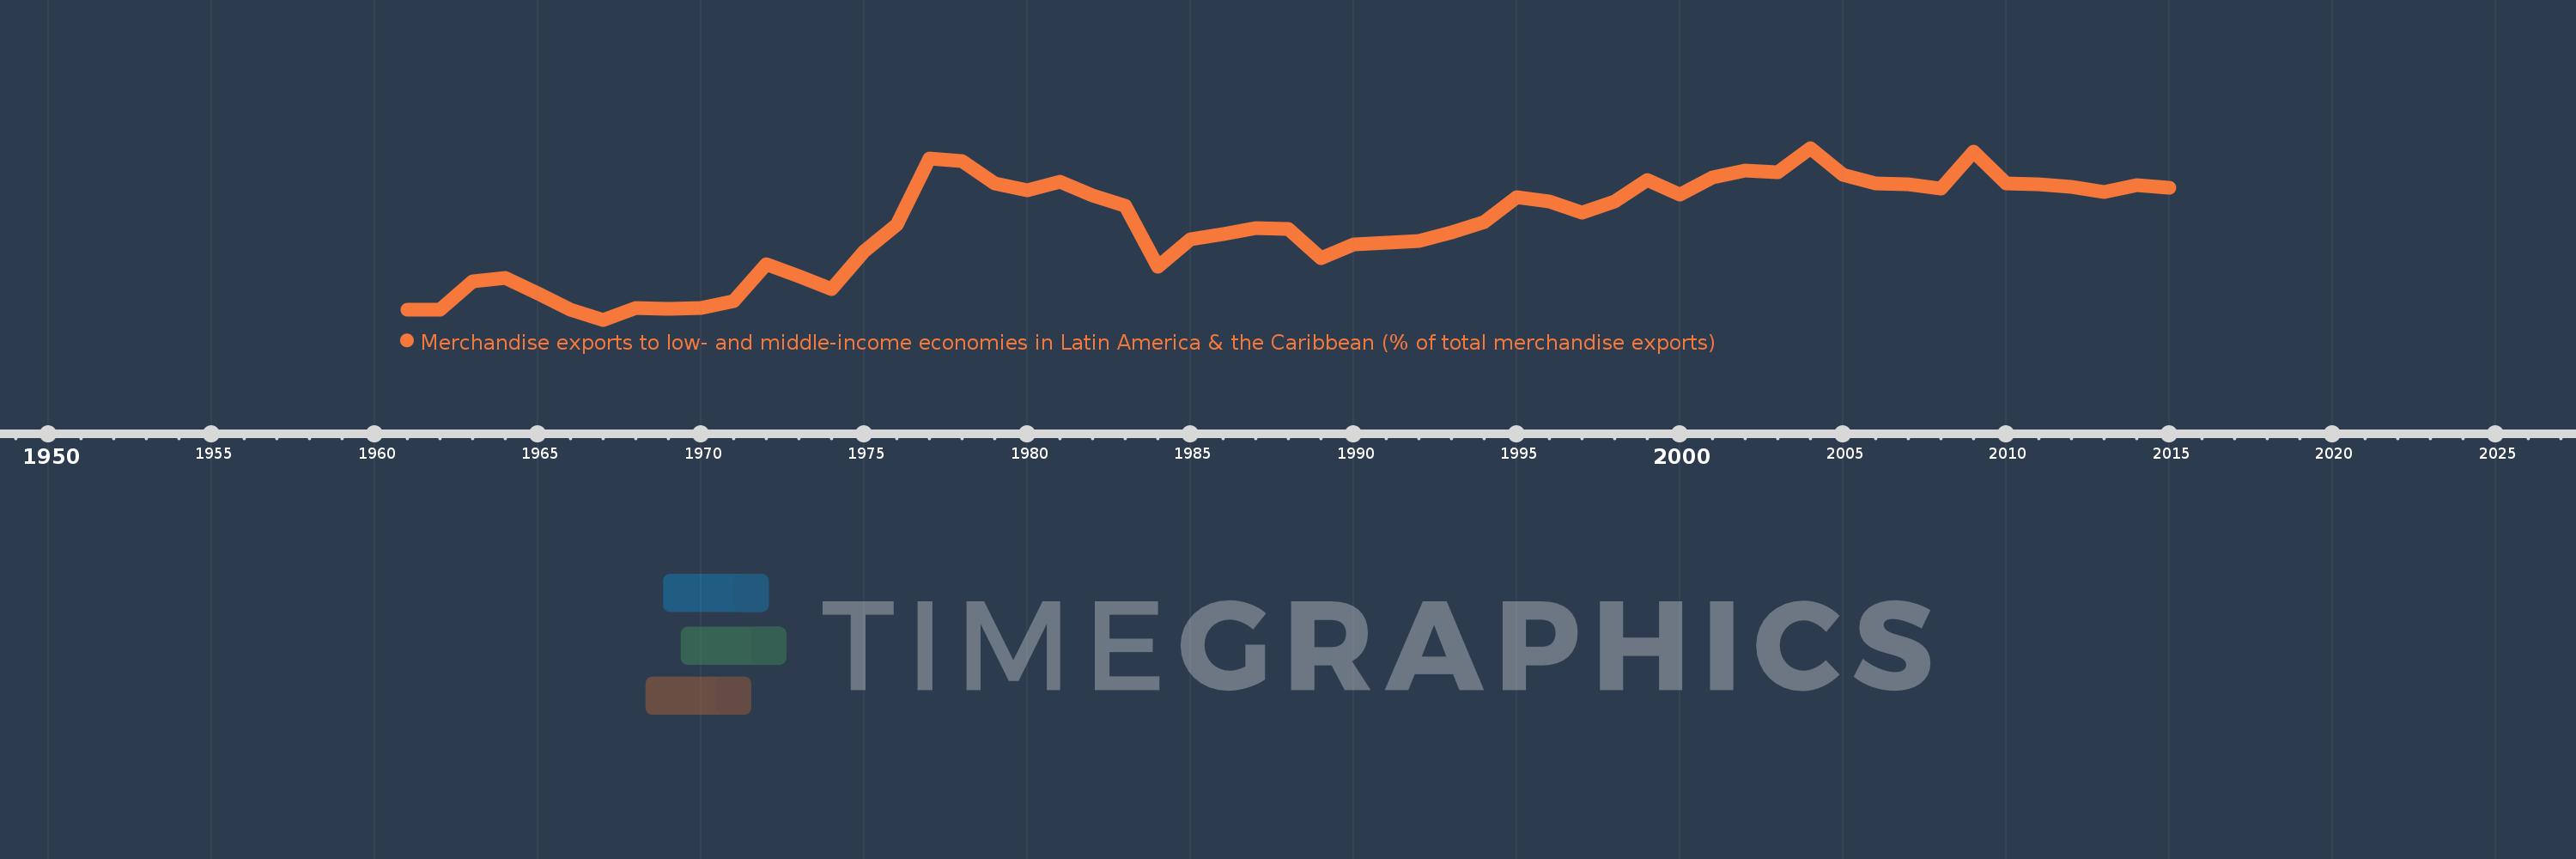
Merchandise exports to low- and middle-income economies in Latin America & the Caribbean (% of total merchandise exports)
2015,2014,2013,2012,2011,2010,2009,2008,2007,2006,2005,2004,2003,2002,2001,2000,1999,1998,1997,1996,1995,1994,1993,1992,1991,1990,1989,1988,1987,1986,1985,1984,1983,1982,1981,1980,1979,1978,1977,1976,1975,1974,1973,1972,1971,1970,1969,1968,1967,1966,1965,1964,1963,1962,1961
Estas estadísticas en otros países:
AfghanistanAlbaniaAlgeriaAngolaAntigua and BarbudaArab WorldArgentinaArmeniaArubaAustraliaAustriaAzerbaijanBahamas, TheBahrainBangladeshBarbadosBelarusBelgiumBelizeBeninBermudaBoliviaBrazilBrunei DarussalamBulgariaBurundiCabo VerdeCambodiaCameroonCanadaCaribbean small statesCentral African RepublicCentral Europe and the BalticsChileChinaColombiaCongo, Dem. Rep.Congo, Rep.Costa RicaCote d'IvoireCroatiaCubaCyprusCzech RepublicDenmarkDominicaDominican RepublicEarly-demographic dividendEast Asia & PacificEast Asia & Pacific (excluding high income)East Asia & Pacific (IDA & IBRD countries)EcuadorEgypt, Arab Rep.El SalvadorEstoniaEthiopiaEuro areaEurope & Central AsiaEurope & Central Asia (excluding high income)Europe & Central Asia (IDA & IBRD countries)European UnionFaroe IslandsFijiFinlandFragile and conflict affected situationsFranceFrench PolynesiaGabonGambia, TheGeorgiaGermanyGhanaGibraltarGreeceGreenlandGrenadaGuatemalaGuineaGuyanaHaitiHeavily indebted poor countries (HIPC)High incomeHondurasHong Kong SAR, ChinaHungaryIBRD onlyIcelandIDA & IBRD totalIDA blendIDA onlyIDA totalIndiaIndonesiaIran, Islamic Rep.IraqIrelandIsraelItalyJamaicaJapanJordanKazakhstanKenyaKorea, Dem. People’s Rep.Korea, Rep.KuwaitLao PDRLate-demographic dividendLatin America & Caribbean Latin America & Caribbean (excluding high income)Latin America & the Caribbean (IDA & IBRD countries)LatviaLeast developed countries: UN classificationLebanonLiberiaLibyaLithuaniaLow & middle incomeLow incomeLower middle incomeLuxembourgMacao SAR, ChinaMacedonia, FYRMadagascarMalawiMalaysiaMaliMaltaMauritaniaMauritiusMexicoMiddle East & North AfricaMiddle East & North Africa (excluding high income)Middle East & North Africa (IDA & IBRD countries)Middle incomeMongoliaMontenegroMoroccoMozambiqueMyanmarNetherlandsNew CaledoniaNew ZealandNicaraguaNigerNigeriaNorth AmericaNorwayOECD membersOmanOther small statesPacific island small statesPakistanPanamaPapua New GuineaParaguayPeruPhilippinesPolandPortugalPost-demographic dividendPre-demographic dividendQatarRomaniaRussian FederationRwandaSamoaSaudi ArabiaSenegalSerbiaSierra LeoneSingaporeSlovak RepublicSloveniaSmall statesSomaliaSouth AfricaSouth AsiaSouth Asia (IDA & IBRD)SpainSri LankaSt. Kitts and NevisSt. LuciaSt. Vincent and the GrenadinesSub-Saharan Africa Sub-Saharan Africa (excluding high income)Sub-Saharan Africa (IDA & IBRD countries)SudanSurinameSwedenSwitzerlandSyrian Arab RepublicTanzaniaThailandTogoTrinidad and TobagoTunisiaTurkeyUgandaUkraineUnited Arab EmiratesUnited KingdomUnited StatesUpper middle incomeUruguayVenezuela, RBVietnamWorldYemen, Rep.ZambiaZimbabwe línea de tiempo (timeline):
En esta escala de tiempo se presenta un gráfico de 1961 y 2015 de Chile. Los datos de 1960 están ausentes. El número de observaciones reales por fecha: 55.
Fuente (nombre):
Indicadores del desarrollo mundial
Fuente (organización):
World Bank staff estimates based data from International Monetary Fund's Direction of Trade database.
Categorías:
Private Sector, Trade
Se ha actualizado:
23 abr 2017 año
Los indicadores de los cambios de valor en los últimos años
Mínimo:
2.839
1 ene 1967 año
Máximo:
19.091
1 ene 2004 año
A la fecha de observación
Valor
Cambio absoluto
El cambio con respecto al valor anterior
1 ene 1961 año
3.778
+3.778
0.0%
1 ene 1962 año
3.814
+0.037
0.97%
1 ene 1963 año
6.449
+2.634
69.06%
1 ene 1964 año
6.795
+0.346
5.37%
1 ene 1965 año
5.36
-1.435
-21.11%
1 ene 1966 año
3.795
-1.565
-29.2%
1 ene 1967 año
2.839
-0.955
-25.18%
1 ene 1968 año
3.913
+1.073
37.8%
1 ene 1969 año
3.838
-0.074
-1.9%
1 ene 1970 año
3.966
+0.128
3.33%
1 ene 1971 año
4.612
+0.646
16.29%
1 ene 1972 año
8.083
+3.472
75.28%
1 ene 1973 año
6.943
-1.141
-14.11%
1 ene 1974 año
5.776
-1.167
-16.81%
1 ene 1975 año
9.292
+3.516
60.87%
1 ene 1976 año
11.794
+2.502
26.93%
1 ene 1977 año
18.084
+6.29
53.33%
1 ene 1978 año
17.872
-0.212
-1.17%
1 ene 1979 año
15.707
-2.165
-12.11%
1 ene 1980 año
15.082
-0.626
-3.98%
1 ene 1981 año
15.861
+0.779
5.17%
1 ene 1982 año
14.565
-1.296
-8.17%
1 ene 1983 año
13.65
-0.915
-6.28%
1 ene 1984 año
7.88
-5.77
-42.27%
1 ene 1985 año
10.418
+2.539
32.22%
1 ene 1986 año
10.975
+0.557
5.34%
1 ene 1987 año
11.5
+0.525
4.78%
1 ene 1988 año
11.422
-0.078
-0.68%
1 ene 1989 año
8.658
-2.764
-24.2%
1 ene 1990 año
9.938
+1.28
14.79%
1 ene 1991 año
10.119
+0.181
1.82%
1 ene 1992 año
10.312
+0.193
1.9%
1 ene 1993 año
11.064
+0.752
7.29%
1 ene 1994 año
12.048
+0.984
8.9%
1 ene 1995 año
14.446
+2.399
19.91%
1 ene 1996 año
14.057
-0.39
-2.7%
1 ene 1997 año
12.937
-1.119
-7.96%
1 ene 1998 año
14.068
+1.131
8.74%
1 ene 1999 año
16.021
+1.953
13.88%
1 ene 2000 año
14.662
-1.36
-8.49%
1 ene 2001 año
16.293
+1.631
11.13%
1 ene 2002 año
16.986
+0.693
4.25%
1 ene 2003 año
16.758
-0.228
-1.34%
1 ene 2004 año
19.091
+2.333
13.92%
1 ene 2005 año
16.579
-2.512
-13.16%
1 ene 2006 año
15.696
-0.883
-5.33%
1 ene 2007 año
15.667
-0.029
-0.19%
1 ene 2008 año
15.251
-0.416
-2.65%
1 ene 2009 año
18.711
+3.46
22.69%
1 ene 2010 año
15.725
-2.986
-15.96%
1 ene 2011 año
15.688
-0.037
-0.24%
1 ene 2012 año
15.395
-0.292
-1.86%
1 ene 2013 año
14.957
-0.439
-2.85%
1 ene 2014 año
15.537
+0.58
3.88%
1 ene 2015 año
15.345
-0.192
-1.23%
Ranking de los países por los datos estadísticos actuales


Comentarios: