29
/es/
es
AIzaSyAYiBZKx7MnpbEhh9jyipgxe19OcubqV5w
April 1, 2024
275934
United Kingdom
GBR
true
2
1
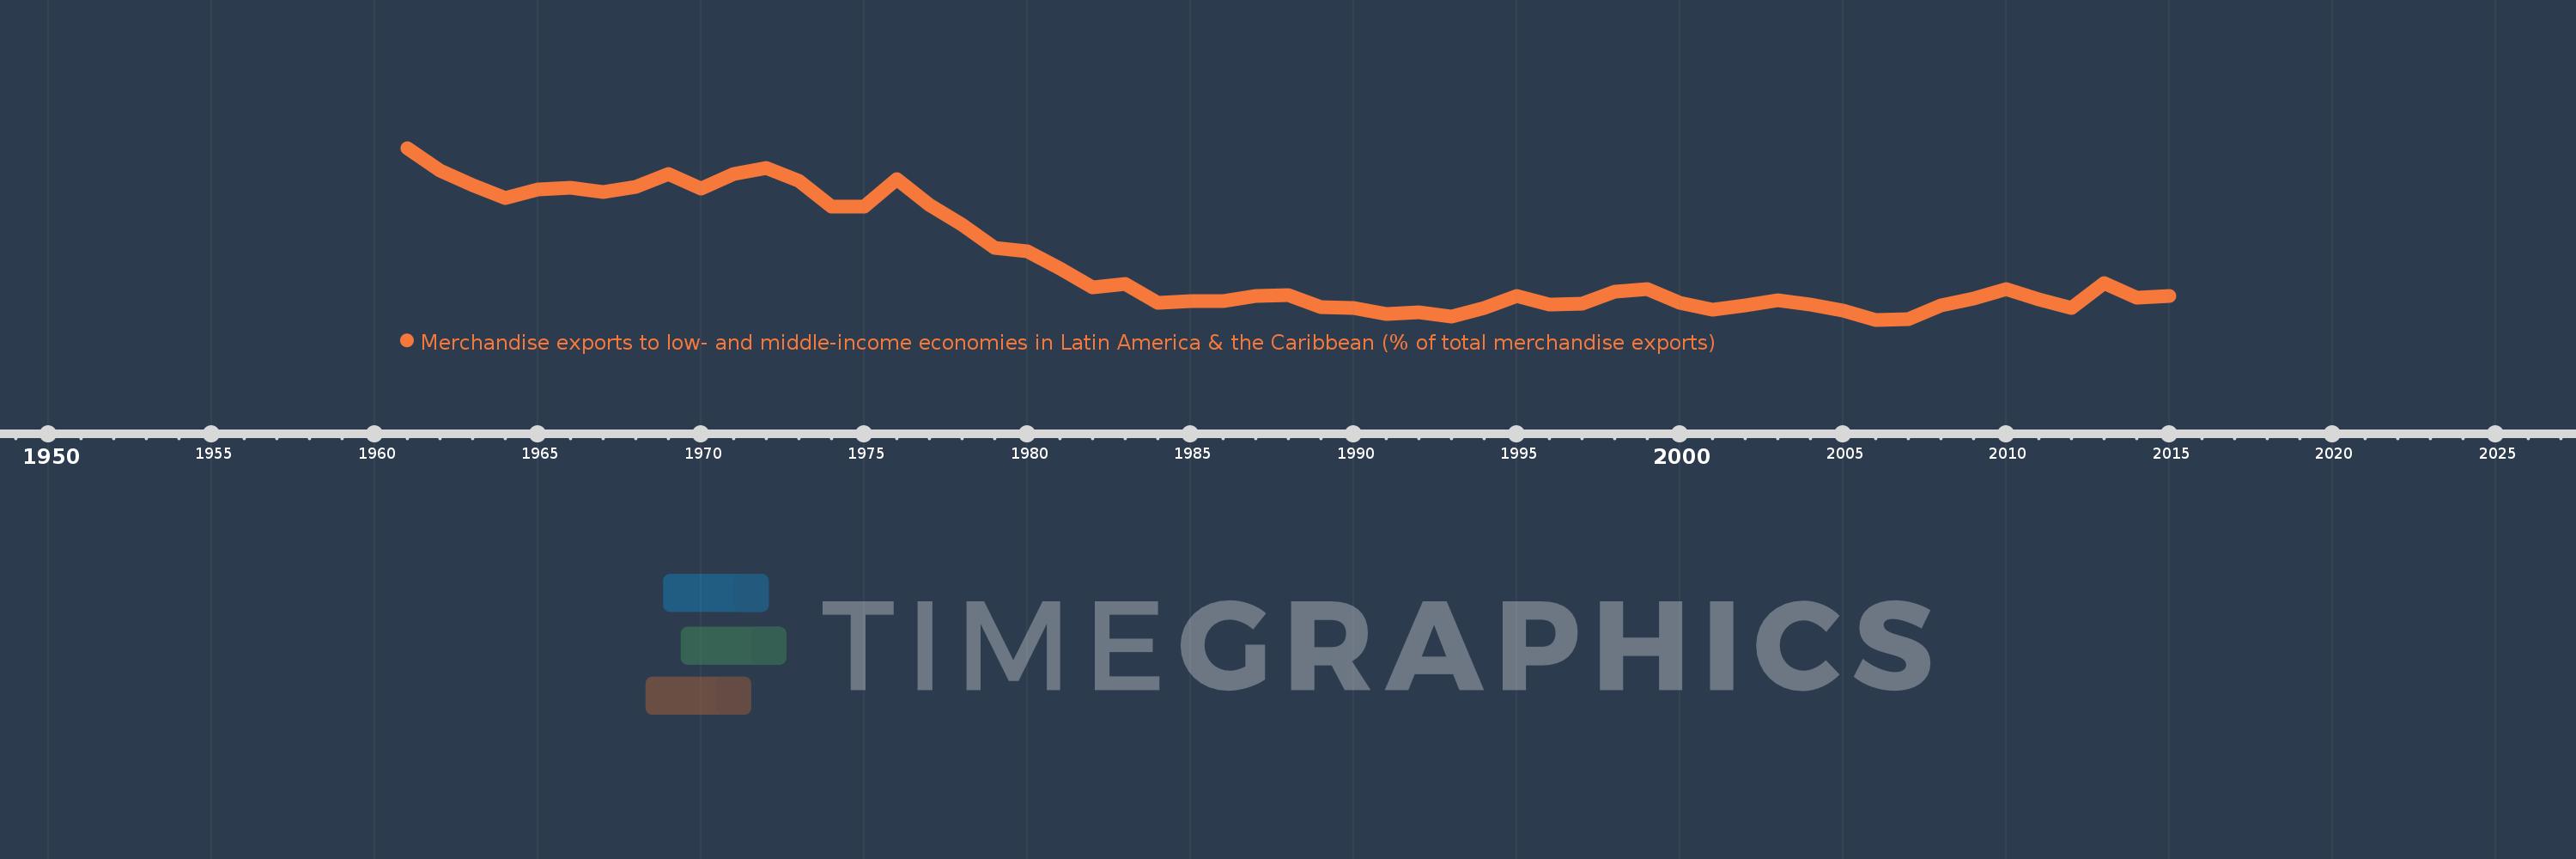
Merchandise exports to low- and middle-income economies in Latin America & the Caribbean (% of total merchandise exports)
2015,2014,2013,2012,2011,2010,2009,2008,2007,2006,2005,2004,2003,2002,2001,2000,1999,1998,1997,1996,1995,1994,1993,1992,1991,1990,1989,1988,1987,1986,1985,1984,1983,1982,1981,1980,1979,1978,1977,1976,1975,1974,1973,1972,1971,1970,1969,1968,1967,1966,1965,1964,1963,1962,1961
Estas estadísticas en otros países:
AfghanistanAlbaniaAlgeriaAngolaAntigua and BarbudaArab WorldArgentinaArmeniaArubaAustraliaAustriaAzerbaijanBahamas, TheBahrainBangladeshBarbadosBelarusBelgiumBelizeBeninBermudaBoliviaBrazilBrunei DarussalamBulgariaBurundiCabo VerdeCambodiaCameroonCanadaCaribbean small statesCentral African RepublicCentral Europe and the BalticsChileChinaColombiaCongo, Dem. Rep.Congo, Rep.Costa RicaCote d'IvoireCroatiaCubaCyprusCzech RepublicDenmarkDominicaDominican RepublicEarly-demographic dividendEast Asia & PacificEast Asia & Pacific (excluding high income)East Asia & Pacific (IDA & IBRD countries)EcuadorEgypt, Arab Rep.El SalvadorEstoniaEthiopiaEuro areaEurope & Central AsiaEurope & Central Asia (excluding high income)Europe & Central Asia (IDA & IBRD countries)European UnionFaroe IslandsFijiFinlandFragile and conflict affected situationsFranceFrench PolynesiaGabonGambia, TheGeorgiaGermanyGhanaGibraltarGreeceGreenlandGrenadaGuatemalaGuineaGuyanaHaitiHeavily indebted poor countries (HIPC)High incomeHondurasHong Kong SAR, ChinaHungaryIBRD onlyIcelandIDA & IBRD totalIDA blendIDA onlyIDA totalIndiaIndonesiaIran, Islamic Rep.IraqIrelandIsraelItalyJamaicaJapanJordanKazakhstanKenyaKorea, Dem. People’s Rep.Korea, Rep.KuwaitLao PDRLate-demographic dividendLatin America & Caribbean Latin America & Caribbean (excluding high income)Latin America & the Caribbean (IDA & IBRD countries)LatviaLeast developed countries: UN classificationLebanonLiberiaLibyaLithuaniaLow & middle incomeLow incomeLower middle incomeLuxembourgMacao SAR, ChinaMacedonia, FYRMadagascarMalawiMalaysiaMaliMaltaMauritaniaMauritiusMexicoMiddle East & North AfricaMiddle East & North Africa (excluding high income)Middle East & North Africa (IDA & IBRD countries)Middle incomeMongoliaMontenegroMoroccoMozambiqueMyanmarNetherlandsNew CaledoniaNew ZealandNicaraguaNigerNigeriaNorth AmericaNorwayOECD membersOmanOther small statesPacific island small statesPakistanPanamaPapua New GuineaParaguayPeruPhilippinesPolandPortugalPost-demographic dividendPre-demographic dividendQatarRomaniaRussian FederationRwandaSamoaSaudi ArabiaSenegalSerbiaSierra LeoneSingaporeSlovak RepublicSloveniaSmall statesSomaliaSouth AfricaSouth AsiaSouth Asia (IDA & IBRD)SpainSri LankaSt. Kitts and NevisSt. LuciaSt. Vincent and the GrenadinesSub-Saharan Africa Sub-Saharan Africa (excluding high income)Sub-Saharan Africa (IDA & IBRD countries)SudanSurinameSwedenSwitzerlandSyrian Arab RepublicTanzaniaThailandTogoTrinidad and TobagoTunisiaTurkeyUgandaUkraineUnited Arab EmiratesUnited KingdomUnited StatesUpper middle incomeUruguayVenezuela, RBVietnamWorldYemen, Rep.ZambiaZimbabwe línea de tiempo (timeline):
En esta escala de tiempo se presenta un gráfico de 1961 y 2015 de United Kingdom. Los datos de 1960 están ausentes. El número de observaciones reales por fecha: 55.
Fuente (nombre):
Indicadores del desarrollo mundial
Fuente (organización):
World Bank staff estimates based data from International Monetary Fund's Direction of Trade database.
Categorías:
Private Sector, Trade
Se ha actualizado:
23 abr 2017 año
Los indicadores de los cambios de valor en los últimos años
Mínimo:
0.937
1 ene 2006 año
Máximo:
3.324
1 ene 1961 año
A la fecha de observación
Valor
Cambio absoluto
El cambio con respecto al valor anterior
1 ene 1961 año
3.324
+3.324
0.0%
1 ene 1962 año
3.008
-0.316
-9.49%
1 ene 1963 año
2.804
-0.204
-6.77%
1 ene 1964 año
2.625
-0.179
-6.4%
1 ene 1965 año
2.746
+0.121
4.62%
1 ene 1966 año
2.771
+0.025
0.89%
1 ene 1967 año
2.716
-0.054
-1.96%
1 ene 1968 año
2.788
+0.072
2.65%
1 ene 1969 año
2.965
+0.177
6.34%
1 ene 1970 año
2.764
-0.201
-6.79%
1 ene 1971 año
2.963
+0.199
7.2%
1 ene 1972 año
3.046
+0.083
2.79%
1 ene 1973 año
2.871
-0.174
-5.72%
1 ene 1974 año
2.512
-0.36
-12.53%
1 ene 1975 año
2.508
-0.004
-0.14%
1 ene 1976 año
2.888
+0.38
15.16%
1 ene 1977 año
2.532
-0.356
-12.33%
1 ene 1978 año
2.261
-0.271
-10.72%
1 ene 1979 año
1.938
-0.322
-14.26%
1 ene 1980 año
1.89
-0.048
-2.49%
1 ene 1981 año
1.65
-0.24
-12.72%
1 ene 1982 año
1.388
-0.261
-15.85%
1 ene 1983 año
1.44
+0.051
3.68%
1 ene 1984 año
1.17
-0.269
-18.71%
1 ene 1985 año
1.198
+0.028
2.4%
1 ene 1986 año
1.192
-0.007
-0.54%
1 ene 1987 año
1.27
+0.078
6.52%
1 ene 1988 año
1.274
+0.004
0.32%
1 ene 1989 año
1.115
-0.159
-12.45%
1 ene 1990 año
1.099
-0.016
-1.44%
1 ene 1991 año
1.016
-0.082
-7.5%
1 ene 1992 año
1.035
+0.019
1.83%
1 ene 1993 año
0.982
-0.053
-5.17%
1 ene 1994 año
1.097
+0.116
11.78%
1 ene 1995 año
1.262
+0.165
15.01%
1 ene 1996 año
1.149
-0.113
-8.92%
1 ene 1997 año
1.157
+0.008
0.7%
1 ene 1998 año
1.323
+0.166
14.31%
1 ene 1999 año
1.369
+0.046
3.51%
1 ene 2000 año
1.172
-0.197
-14.42%
1 ene 2001 año
1.078
-0.094
-8.01%
1 ene 2002 año
1.133
+0.055
5.14%
1 ene 2003 año
1.203
+0.07
6.17%
1 ene 2004 año
1.143
-0.061
-5.03%
1 ene 2005 año
1.064
-0.079
-6.89%
1 ene 2006 año
0.937
-0.127
-11.96%
1 ene 2007 año
0.94
+0.003
0.35%
1 ene 2008 año
1.14
+0.2
21.26%
1 ene 2009 año
1.228
+0.088
7.68%
1 ene 2010 año
1.366
+0.138
11.25%
1 ene 2011 año
1.221
-0.144
-10.58%
1 ene 2012 año
1.103
-0.118
-9.68%
1 ene 2013 año
1.452
+0.349
31.63%
1 ene 2014 año
1.24
-0.212
-14.62%
1 ene 2015 año
1.263
+0.024
1.9%
Ranking de los países por los datos estadísticos actuales


Comentarios: