29
/es/
es
AIzaSyAYiBZKx7MnpbEhh9jyipgxe19OcubqV5w
April 1, 2024
107539
Colombia
COL
true
2
1
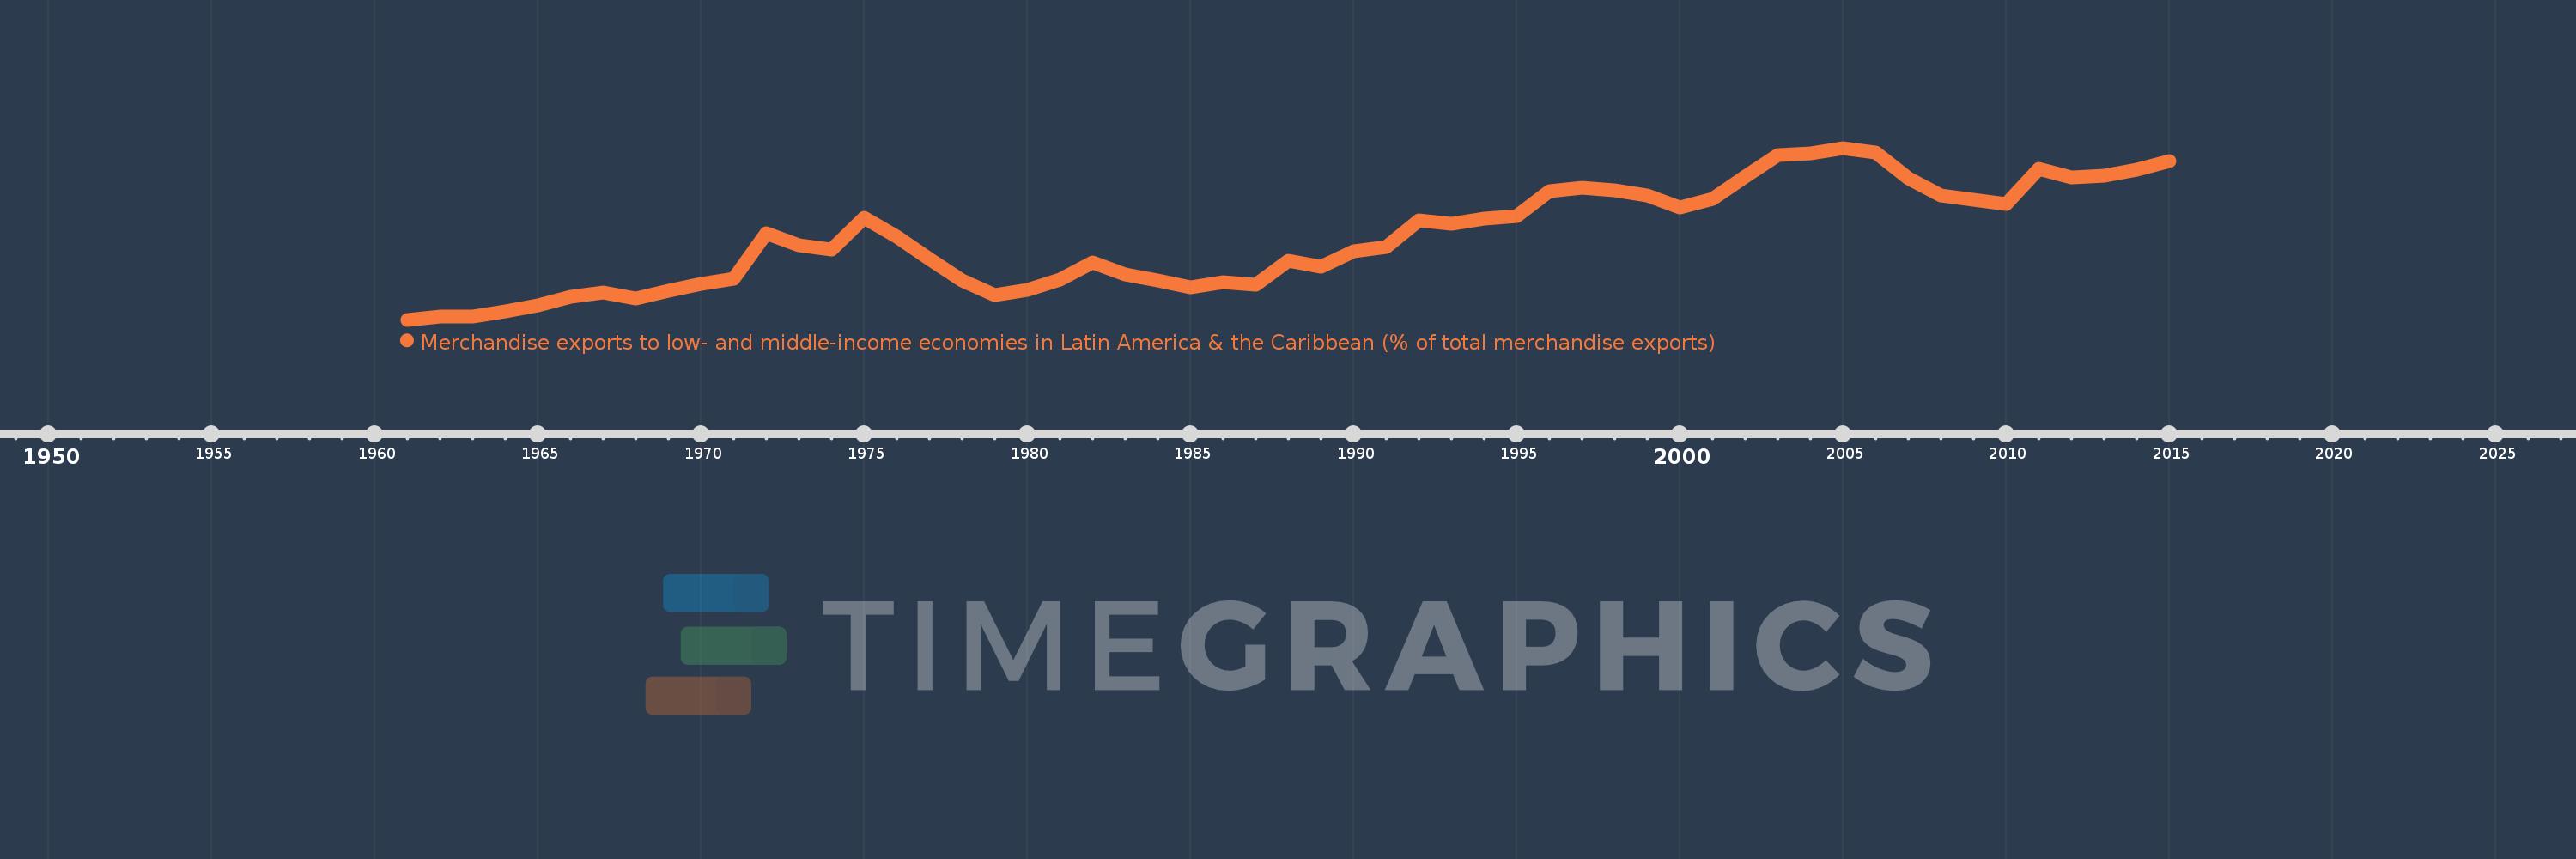
Merchandise exports to low- and middle-income economies in Latin America & the Caribbean (% of total merchandise exports)
2015,2014,2013,2012,2011,2010,2009,2008,2007,2006,2005,2004,2003,2002,2001,2000,1999,1998,1997,1996,1995,1994,1993,1992,1991,1990,1989,1988,1987,1986,1985,1984,1983,1982,1981,1980,1979,1978,1977,1976,1975,1974,1973,1972,1971,1970,1969,1968,1967,1966,1965,1964,1963,1962,1961
Estas estadísticas en otros países:
AfghanistanAlbaniaAlgeriaAngolaAntigua and BarbudaArab WorldArgentinaArmeniaArubaAustraliaAustriaAzerbaijanBahamas, TheBahrainBangladeshBarbadosBelarusBelgiumBelizeBeninBermudaBoliviaBrazilBrunei DarussalamBulgariaBurundiCabo VerdeCambodiaCameroonCanadaCaribbean small statesCentral African RepublicCentral Europe and the BalticsChileChinaColombiaCongo, Dem. Rep.Congo, Rep.Costa RicaCote d'IvoireCroatiaCubaCyprusCzech RepublicDenmarkDominicaDominican RepublicEarly-demographic dividendEast Asia & PacificEast Asia & Pacific (excluding high income)East Asia & Pacific (IDA & IBRD countries)EcuadorEgypt, Arab Rep.El SalvadorEstoniaEthiopiaEuro areaEurope & Central AsiaEurope & Central Asia (excluding high income)Europe & Central Asia (IDA & IBRD countries)European UnionFaroe IslandsFijiFinlandFragile and conflict affected situationsFranceFrench PolynesiaGabonGambia, TheGeorgiaGermanyGhanaGibraltarGreeceGreenlandGrenadaGuatemalaGuineaGuyanaHaitiHeavily indebted poor countries (HIPC)High incomeHondurasHong Kong SAR, ChinaHungaryIBRD onlyIcelandIDA & IBRD totalIDA blendIDA onlyIDA totalIndiaIndonesiaIran, Islamic Rep.IraqIrelandIsraelItalyJamaicaJapanJordanKazakhstanKenyaKorea, Dem. People’s Rep.Korea, Rep.KuwaitLao PDRLate-demographic dividendLatin America & Caribbean Latin America & Caribbean (excluding high income)Latin America & the Caribbean (IDA & IBRD countries)LatviaLeast developed countries: UN classificationLebanonLiberiaLibyaLithuaniaLow & middle incomeLow incomeLower middle incomeLuxembourgMacao SAR, ChinaMacedonia, FYRMadagascarMalawiMalaysiaMaliMaltaMauritaniaMauritiusMexicoMiddle East & North AfricaMiddle East & North Africa (excluding high income)Middle East & North Africa (IDA & IBRD countries)Middle incomeMongoliaMontenegroMoroccoMozambiqueMyanmarNetherlandsNew CaledoniaNew ZealandNicaraguaNigerNigeriaNorth AmericaNorwayOECD membersOmanOther small statesPacific island small statesPakistanPanamaPapua New GuineaParaguayPeruPhilippinesPolandPortugalPost-demographic dividendPre-demographic dividendQatarRomaniaRussian FederationRwandaSamoaSaudi ArabiaSenegalSerbiaSierra LeoneSingaporeSlovak RepublicSloveniaSmall statesSomaliaSouth AfricaSouth AsiaSouth Asia (IDA & IBRD)SpainSri LankaSt. Kitts and NevisSt. LuciaSt. Vincent and the GrenadinesSub-Saharan Africa Sub-Saharan Africa (excluding high income)Sub-Saharan Africa (IDA & IBRD countries)SudanSurinameSwedenSwitzerlandSyrian Arab RepublicTanzaniaThailandTogoTrinidad and TobagoTunisiaTurkeyUgandaUkraineUnited Arab EmiratesUnited KingdomUnited StatesUpper middle incomeUruguayVenezuela, RBVietnamWorldYemen, Rep.ZambiaZimbabwe línea de tiempo (timeline):
En esta escala de tiempo se presenta un gráfico de 1961 y 2015 de Colombia. Los datos de 1960 están ausentes. El número de observaciones reales por fecha: 55.
Fuente (nombre):
Indicadores del desarrollo mundial
Fuente (organización):
World Bank staff estimates based data from International Monetary Fund's Direction of Trade database.
Categorías:
Private Sector, Trade
Se ha actualizado:
23 abr 2017 año
Los indicadores de los cambios de valor en los últimos años
Mínimo:
1.375
1 ene 1961 año
Máximo:
21.169
1 ene 2005 año
A la fecha de observación
Valor
Cambio absoluto
El cambio con respecto al valor anterior
1 ene 1961 año
1.375
+1.375
0.0%
1 ene 1962 año
1.724
+0.349
25.35%
1 ene 1963 año
1.765
+0.042
2.41%
1 ene 1964 año
2.304
+0.538
30.5%
1 ene 1965 año
3.063
+0.76
32.98%
1 ene 1966 año
3.99
+0.926
30.23%
1 ene 1967 año
4.53
+0.541
13.55%
1 ene 1968 año
3.785
-0.745
-16.45%
1 ene 1969 año
4.67
+0.885
23.39%
1 ene 1970 año
5.497
+0.827
17.7%
1 ene 1971 año
6.133
+0.636
11.57%
1 ene 1972 año
11.379
+5.246
85.54%
1 ene 1973 año
9.967
-1.413
-12.41%
1 ene 1974 año
9.486
-0.481
-4.82%
1 ene 1975 año
13.132
+3.646
38.44%
1 ene 1976 año
10.909
-2.223
-16.93%
1 ene 1977 año
8.37
-2.539
-23.28%
1 ene 1978 año
5.916
-2.454
-29.32%
1 ene 1979 año
4.205
-1.711
-28.92%
1 ene 1980 año
4.849
+0.645
15.33%
1 ene 1981 año
6.015
+1.166
24.05%
1 ene 1982 año
7.969
+1.953
32.47%
1 ene 1983 año
6.626
-1.343
-16.86%
1 ene 1984 año
5.878
-0.747
-11.28%
1 ene 1985 año
5.076
-0.803
-13.65%
1 ene 1986 año
5.689
+0.613
12.09%
1 ene 1987 año
5.378
-0.311
-5.46%
1 ene 1988 año
8.125
+2.746
51.06%
1 ene 1989 año
7.48
-0.644
-7.93%
1 ene 1990 año
9.249
+1.769
23.64%
1 ene 1991 año
9.711
+0.462
5.0%
1 ene 1992 año
12.79
+3.079
31.71%
1 ene 1993 año
12.449
-0.341
-2.67%
1 ene 1994 año
13.064
+0.615
4.94%
1 ene 1995 año
13.356
+0.292
2.23%
1 ene 1996 año
16.174
+2.818
21.1%
1 ene 1997 año
16.597
+0.424
2.62%
1 ene 1998 año
16.315
-0.283
-1.7%
1 ene 1999 año
15.721
-0.594
-3.64%
1 ene 2000 año
14.316
-1.405
-8.94%
1 ene 2001 año
15.309
+0.993
6.94%
1 ene 2002 año
17.844
+2.535
16.56%
1 ene 2003 año
20.378
+2.533
14.2%
1 ene 2004 año
20.502
+0.125
0.61%
1 ene 2005 año
21.169
+0.667
3.25%
1 ene 2006 año
20.661
-0.508
-2.4%
1 ene 2007 año
17.66
-3.001
-14.53%
1 ene 2008 año
15.65
-2.01
-11.38%
1 ene 2009 año
15.157
-0.493
-3.15%
1 ene 2010 año
14.733
-0.424
-2.8%
1 ene 2011 año
18.788
+4.055
27.52%
1 ene 2012 año
17.806
-0.982
-5.22%
1 ene 2013 año
17.954
+0.148
0.83%
1 ene 2014 año
18.668
+0.714
3.98%
1 ene 2015 año
19.652
+0.983
5.27%
Ranking de los países por los datos estadísticos actuales


Comentarios: