29
/es/
es
AIzaSyAYiBZKx7MnpbEhh9jyipgxe19OcubqV5w
April 1, 2024
51641
North America
NAC
false
2
1
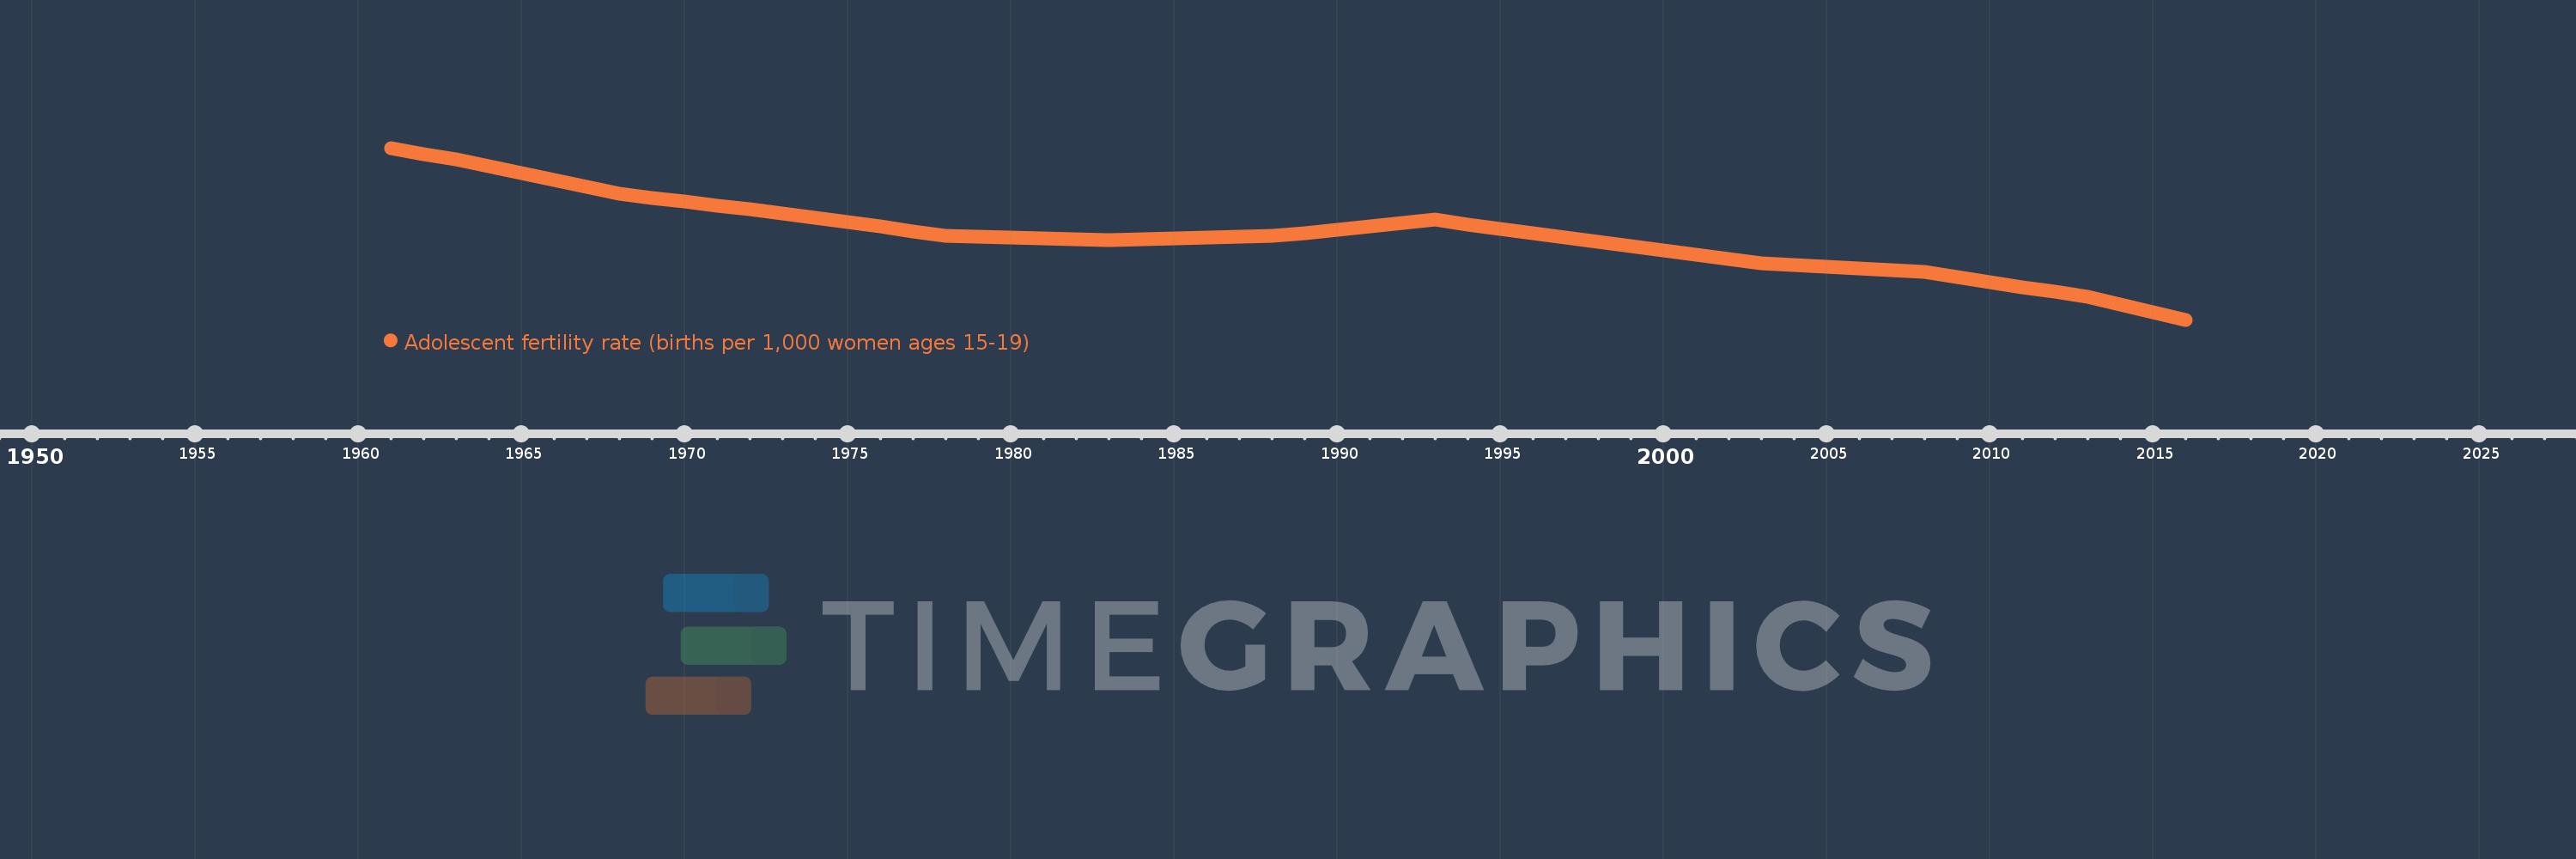
Adolescent fertility rate (births per 1,000 women ages 15-19)
2016,2015,2014,2013,2012,2011,2010,2009,2008,2007,2006,2005,2004,2003,2002,2001,2000,1999,1998,1997,1996,1995,1994,1993,1992,1991,1990,1989,1988,1987,1986,1985,1984,1983,1982,1981,1980,1979,1978,1977,1976,1975,1974,1973,1972,1971,1970,1969,1968,1967,1966,1965,1964,1963,1962,1961
Estas estadísticas en otros países:
AfghanistanAlbaniaAlgeriaAngolaAntigua and BarbudaArab WorldArgentinaArmeniaArubaAustraliaAustriaAzerbaijanBahamas, TheBahrainBangladeshBarbadosBelarusBelgiumBelizeBeninBhutanBoliviaBosnia and HerzegovinaBotswanaBrazilBrunei DarussalamBulgariaBurkina FasoBurundiCabo VerdeCambodiaCameroonCanadaCaribbean small statesCentral African RepublicCentral Europe and the BalticsChadChannel IslandsChileChinaColombiaComorosCongo, Dem. Rep.Congo, Rep.Costa RicaCote d'IvoireCroatiaCubaCuracaoCyprusCzech RepublicDenmarkDjiboutiDominican RepublicEarly-demographic dividendEast Asia & PacificEast Asia & Pacific (excluding high income)East Asia & Pacific (IDA & IBRD countries)EcuadorEgypt, Arab Rep.El SalvadorEquatorial GuineaEritreaEstoniaEthiopiaEuro areaEurope & Central AsiaEurope & Central Asia (excluding high income)Europe & Central Asia (IDA & IBRD countries)European UnionFijiFinlandFragile and conflict affected situationsFranceFrench PolynesiaGabonGambia, TheGeorgiaGermanyGhanaGreeceGrenadaGuamGuatemalaGuineaGuinea-BissauGuyanaHaitiHeavily indebted poor countries (HIPC)High incomeHondurasHong Kong SAR, ChinaHungaryIBRD onlyIcelandIDA & IBRD totalIDA blendIDA onlyIDA totalIndiaIndonesiaIran, Islamic Rep.IraqIrelandIsraelItalyJamaicaJapanJordanKazakhstanKenyaKiribatiKorea, Dem. People’s Rep.Korea, Rep.KuwaitKyrgyz RepublicLao PDRLate-demographic dividendLatin America & Caribbean Latin America & Caribbean (excluding high income)Latin America & the Caribbean (IDA & IBRD countries)LatviaLeast developed countries: UN classificationLebanonLesothoLiberiaLibyaLithuaniaLow & middle incomeLow incomeLower middle incomeLuxembourgMacao SAR, ChinaMacedonia, FYRMadagascarMalawiMalaysiaMaldivesMaliMaltaMauritaniaMauritiusMexicoMicronesia, Fed. Sts.Middle East & North AfricaMiddle East & North Africa (excluding high income)Middle East & North Africa (IDA & IBRD countries)Middle incomeMoldovaMongoliaMontenegroMoroccoMozambiqueMyanmarNamibiaNepalNetherlandsNew CaledoniaNew ZealandNicaraguaNigerNigeriaNorth AmericaNorwayOECD membersOmanOther small statesPacific island small statesPakistanPanamaPapua New GuineaParaguayPeruPhilippinesPolandPortugalPost-demographic dividendPre-demographic dividendPuerto RicoQatarRomaniaRussian FederationRwandaSamoaSao Tome and PrincipeSaudi ArabiaSenegalSerbiaSeychellesSierra LeoneSingaporeSlovak RepublicSloveniaSmall statesSolomon IslandsSomaliaSouth AfricaSouth AsiaSouth Asia (IDA & IBRD)South SudanSpainSri LankaSt. LuciaSt. Vincent and the GrenadinesSub-Saharan Africa Sub-Saharan Africa (excluding high income)Sub-Saharan Africa (IDA & IBRD countries)SudanSurinameSwazilandSwedenSwitzerlandSyrian Arab RepublicTajikistanTanzaniaThailandTimor-LesteTogoTongaTrinidad and TobagoTunisiaTurkeyTurkmenistanUgandaUkraineUnited Arab EmiratesUnited KingdomUnited StatesUpper middle incomeUruguayUzbekistanVanuatuVenezuela, RBVietnamVirgin Islands (U.S.)West Bank and GazaWorldYemen, Rep.ZambiaZimbabwe línea de tiempo (timeline):
En esta escala de tiempo se presenta un gráfico de 1961 y 2016 de North America. Los datos de 1960 están ausentes. El número de observaciones reales por fecha: 56.
Fuente (nombre):
Indicadores del desarrollo mundial
Fuente (organización):
United Nations Population Division, World Population Prospects.
Categorías:
Health, Gender, Social Development
Se ha actualizado:
23 abr 2017 año
Los indicadores de los cambios de valor en los últimos años
Mínimo:
20.074
1 ene 2016 año
Máximo:
82.239
1 ene 1961 año
A la fecha de observación
Valor
Cambio absoluto
El cambio con respecto al valor anterior
1 ene 1961 año
82.239
+82.239
0.0%
1 ene 1962 año
80.123
-2.116
-2.57%
1 ene 1963 año
78.004
-2.119
-2.64%
1 ene 1964 año
75.532
-2.473
-3.17%
1 ene 1965 año
73.058
-2.474
-3.28%
1 ene 1966 año
70.584
-2.474
-3.39%
1 ene 1967 año
68.099
-2.485
-3.52%
1 ene 1968 año
65.619
-2.48
-3.64%
1 ene 1969 año
64.226
-1.394
-2.12%
1 ene 1970 año
62.839
-1.387
-2.16%
1 ene 1971 año
61.456
-1.382
-2.2%
1 ene 1972 año
60.064
-1.393
-2.27%
1 ene 1973 año
58.669
-1.395
-2.32%
1 ene 1974 año
57.022
-1.647
-2.81%
1 ene 1975 año
55.373
-1.649
-2.89%
1 ene 1976 año
53.724
-1.65
-2.98%
1 ene 1977 año
52.074
-1.649
-3.07%
1 ene 1978 año
50.425
-1.649
-3.17%
1 ene 1979 año
50.094
-0.331
-0.66%
1 ene 1980 año
49.772
-0.323
-0.64%
1 ene 1981 año
49.45
-0.321
-0.65%
1 ene 1982 año
49.139
-0.312
-0.63%
1 ene 1983 año
48.843
-0.296
-0.6%
1 ene 1984 año
49.157
+0.313
0.64%
1 ene 1985 año
49.474
+0.317
0.65%
1 ene 1986 año
49.785
+0.311
0.63%
1 ene 1987 año
50.075
+0.29
0.58%
1 ene 1988 año
50.345
+0.27
0.54%
1 ene 1989 año
51.514
+1.169
2.32%
1 ene 1990 año
52.672
+1.158
2.25%
1 ene 1991 año
53.849
+1.177
2.24%
1 ene 1992 año
55.022
+1.173
2.18%
1 ene 1993 año
56.204
+1.181
2.15%
1 ene 1994 año
54.622
-1.582
-2.81%
1 ene 1995 año
53.047
-1.574
-2.88%
1 ene 1996 año
51.482
-1.565
-2.95%
1 ene 1997 año
49.902
-1.58
-3.07%
1 ene 1998 año
48.324
-1.577
-3.16%
1 ene 1999 año
46.767
-1.557
-3.22%
1 ene 2000 año
45.21
-1.557
-3.33%
1 ene 2001 año
43.651
-1.56
-3.45%
1 ene 2002 año
42.075
-1.575
-3.61%
1 ene 2003 año
40.503
-1.573
-3.74%
1 ene 2004 año
39.86
-0.643
-1.59%
1 ene 2005 año
39.219
-0.641
-1.61%
1 ene 2006 año
38.578
-0.642
-1.64%
1 ene 2007 año
37.915
-0.663
-1.72%
1 ene 2008 año
37.255
-0.66
-1.74%
1 ene 2009 año
35.455
-1.8
-4.83%
1 ene 2010 año
33.664
-1.791
-5.05%
1 ene 2011 año
31.883
-1.781
-5.29%
1 ene 2012 año
30.092
-1.791
-5.62%
1 ene 2013 año
28.293
-1.799
-5.98%
1 ene 2014 año
25.55
-2.744
-9.7%
1 ene 2015 año
22.808
-2.742
-10.73%
1 ene 2016 año
20.074
-2.734
-11.99%
Ranking de los países por los datos estadísticos actuales


Comentarios: