29
/es/
es
AIzaSyAYiBZKx7MnpbEhh9jyipgxe19OcubqV5w
April 1, 2024
37917
IDA blend
IDB
false
2
1
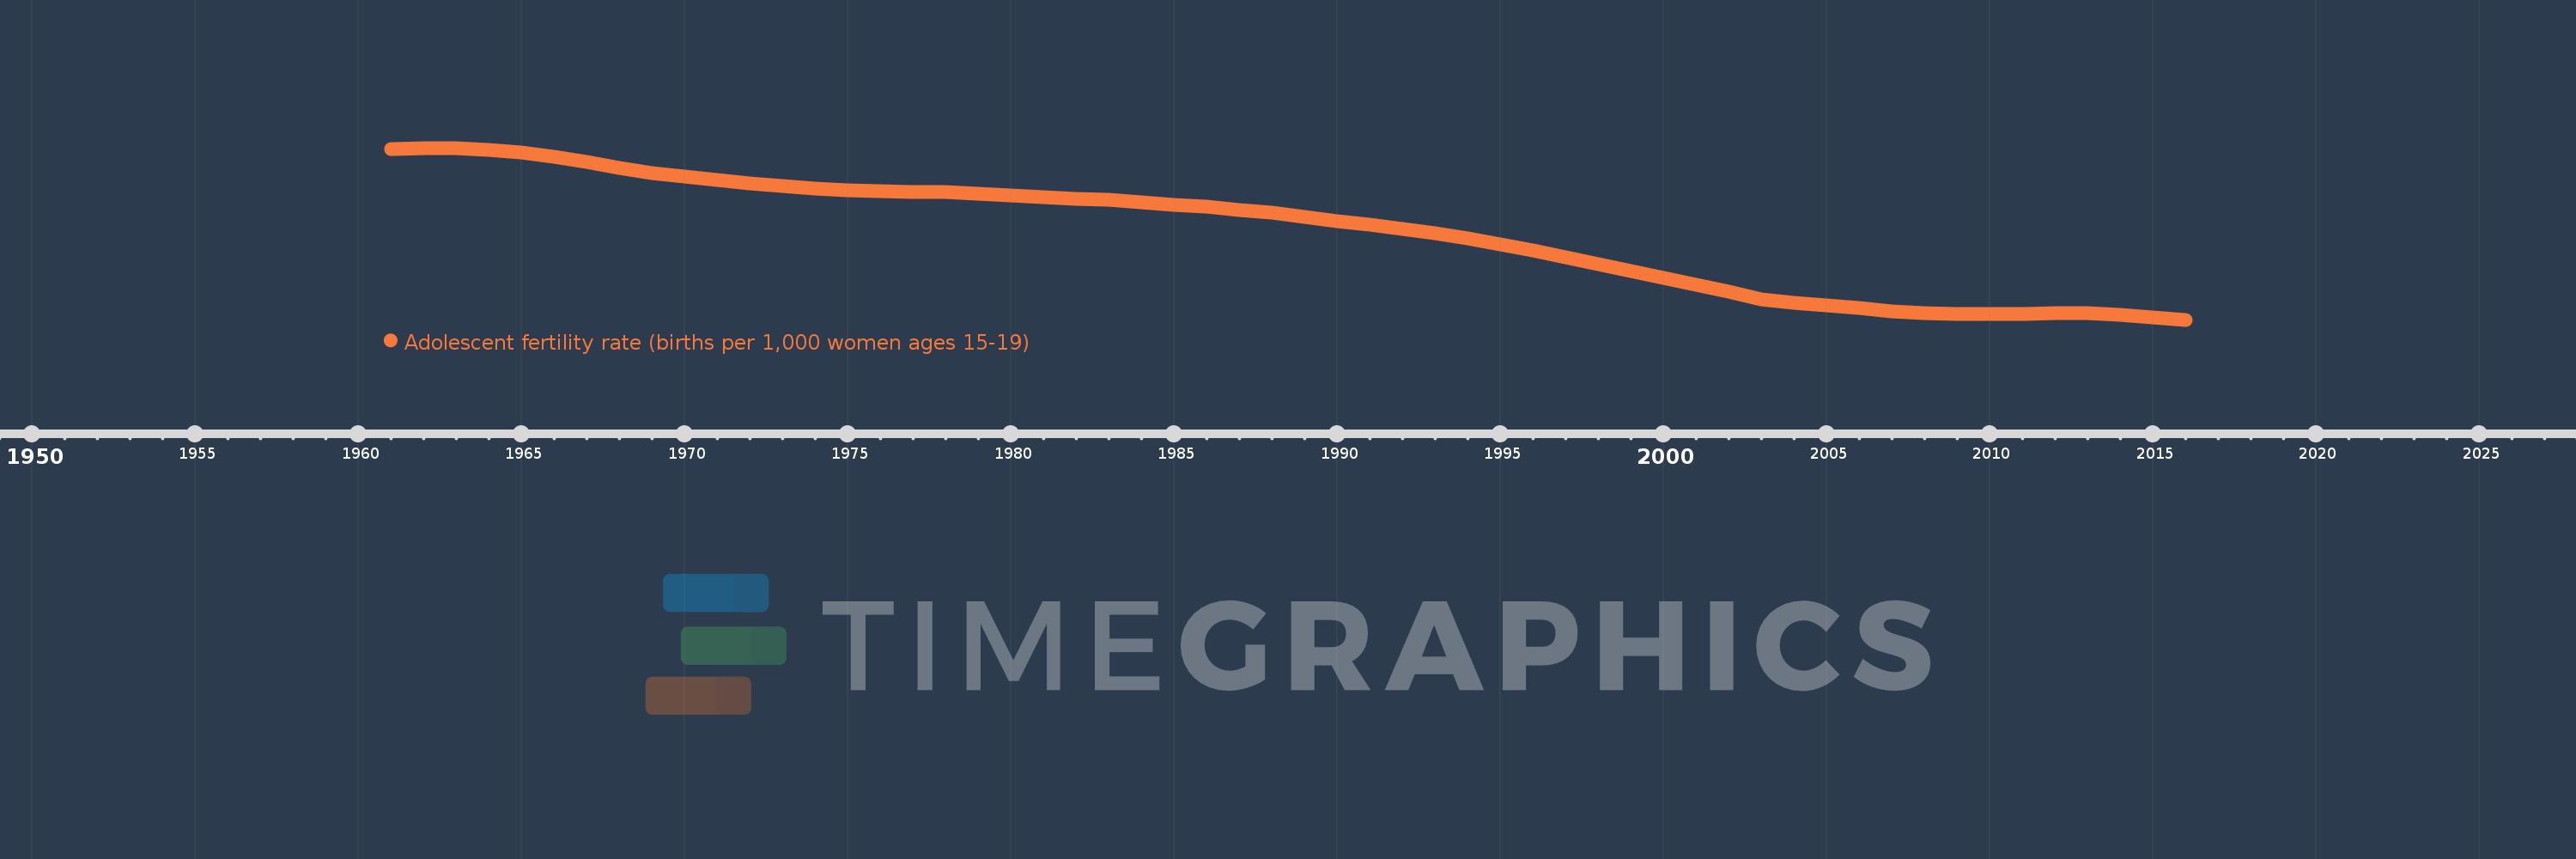
Adolescent fertility rate (births per 1,000 women ages 15-19)
2016,2015,2014,2013,2012,2011,2010,2009,2008,2007,2006,2005,2004,2003,2002,2001,2000,1999,1998,1997,1996,1995,1994,1993,1992,1991,1990,1989,1988,1987,1986,1985,1984,1983,1982,1981,1980,1979,1978,1977,1976,1975,1974,1973,1972,1971,1970,1969,1968,1967,1966,1965,1964,1963,1962,1961
Estas estadísticas en otros países:
AfghanistanAlbaniaAlgeriaAngolaAntigua and BarbudaArab WorldArgentinaArmeniaArubaAustraliaAustriaAzerbaijanBahamas, TheBahrainBangladeshBarbadosBelarusBelgiumBelizeBeninBhutanBoliviaBosnia and HerzegovinaBotswanaBrazilBrunei DarussalamBulgariaBurkina FasoBurundiCabo VerdeCambodiaCameroonCanadaCaribbean small statesCentral African RepublicCentral Europe and the BalticsChadChannel IslandsChileChinaColombiaComorosCongo, Dem. Rep.Congo, Rep.Costa RicaCote d'IvoireCroatiaCubaCuracaoCyprusCzech RepublicDenmarkDjiboutiDominican RepublicEarly-demographic dividendEast Asia & PacificEast Asia & Pacific (excluding high income)East Asia & Pacific (IDA & IBRD countries)EcuadorEgypt, Arab Rep.El SalvadorEquatorial GuineaEritreaEstoniaEthiopiaEuro areaEurope & Central AsiaEurope & Central Asia (excluding high income)Europe & Central Asia (IDA & IBRD countries)European UnionFijiFinlandFragile and conflict affected situationsFranceFrench PolynesiaGabonGambia, TheGeorgiaGermanyGhanaGreeceGrenadaGuamGuatemalaGuineaGuinea-BissauGuyanaHaitiHeavily indebted poor countries (HIPC)High incomeHondurasHong Kong SAR, ChinaHungaryIBRD onlyIcelandIDA & IBRD totalIDA blendIDA onlyIDA totalIndiaIndonesiaIran, Islamic Rep.IraqIrelandIsraelItalyJamaicaJapanJordanKazakhstanKenyaKiribatiKorea, Dem. People’s Rep.Korea, Rep.KuwaitKyrgyz RepublicLao PDRLate-demographic dividendLatin America & Caribbean Latin America & Caribbean (excluding high income)Latin America & the Caribbean (IDA & IBRD countries)LatviaLeast developed countries: UN classificationLebanonLesothoLiberiaLibyaLithuaniaLow & middle incomeLow incomeLower middle incomeLuxembourgMacao SAR, ChinaMacedonia, FYRMadagascarMalawiMalaysiaMaldivesMaliMaltaMauritaniaMauritiusMexicoMicronesia, Fed. Sts.Middle East & North AfricaMiddle East & North Africa (excluding high income)Middle East & North Africa (IDA & IBRD countries)Middle incomeMoldovaMongoliaMontenegroMoroccoMozambiqueMyanmarNamibiaNepalNetherlandsNew CaledoniaNew ZealandNicaraguaNigerNigeriaNorth AmericaNorwayOECD membersOmanOther small statesPacific island small statesPakistanPanamaPapua New GuineaParaguayPeruPhilippinesPolandPortugalPost-demographic dividendPre-demographic dividendPuerto RicoQatarRomaniaRussian FederationRwandaSamoaSao Tome and PrincipeSaudi ArabiaSenegalSerbiaSeychellesSierra LeoneSingaporeSlovak RepublicSloveniaSmall statesSolomon IslandsSomaliaSouth AfricaSouth AsiaSouth Asia (IDA & IBRD)South SudanSpainSri LankaSt. LuciaSt. Vincent and the GrenadinesSub-Saharan Africa Sub-Saharan Africa (excluding high income)Sub-Saharan Africa (IDA & IBRD countries)SudanSurinameSwazilandSwedenSwitzerlandSyrian Arab RepublicTajikistanTanzaniaThailandTimor-LesteTogoTongaTrinidad and TobagoTunisiaTurkeyTurkmenistanUgandaUkraineUnited Arab EmiratesUnited KingdomUnited StatesUpper middle incomeUruguayUzbekistanVanuatuVenezuela, RBVietnamVirgin Islands (U.S.)West Bank and GazaWorldYemen, Rep.ZambiaZimbabwe línea de tiempo (timeline):
En esta escala de tiempo se presenta un gráfico de 1961 y 2016 de IDA blend. Los datos de 1960 están ausentes. El número de observaciones reales por fecha: 56.
Fuente (nombre):
Indicadores del desarrollo mundial
Fuente (organización):
United Nations Population Division, World Population Prospects.
Categorías:
Health, Gender, Social Development
Se ha actualizado:
23 abr 2017 año
Los indicadores de los cambios de valor en los últimos años
Mínimo:
66.774
1 ene 2016 año
Máximo:
110.327
1 ene 1963 año
A la fecha de observación
Valor
Cambio absoluto
El cambio con respecto al valor anterior
1 ene 1961 año
110.105
+110.105
0.0%
1 ene 1962 año
110.309
+0.204
0.18%
1 ene 1963 año
110.327
+0.018
0.02%
1 ene 1964 año
109.853
-0.474
-0.43%
1 ene 1965 año
109.097
-0.756
-0.69%
1 ene 1966 año
108.086
-1.011
-0.93%
1 ene 1967 año
106.707
-1.379
-1.28%
1 ene 1968 año
105.186
-1.521
-1.43%
1 ene 1969 año
104.028
-1.159
-1.1%
1 ene 1970 año
102.98
-1.048
-1.01%
1 ene 1971 año
102.115
-0.865
-0.84%
1 ene 1972 año
101.271
-0.844
-0.83%
1 ene 1973 año
100.632
-0.639
-0.63%
1 ene 1974 año
99.982
-0.65
-0.65%
1 ene 1975 año
99.544
-0.438
-0.44%
1 ene 1976 año
99.282
-0.262
-0.26%
1 ene 1977 año
99.14
-0.142
-0.14%
1 ene 1978 año
99.135
-0.005
-0.01%
1 ene 1979 año
98.655
-0.48
-0.48%
1 ene 1980 año
98.222
-0.433
-0.44%
1 ene 1981 año
97.821
-0.401
-0.41%
1 ene 1982 año
97.437
-0.383
-0.39%
1 ene 1983 año
97.101
-0.336
-0.35%
1 ene 1984 año
96.545
-0.556
-0.57%
1 ene 1985 año
95.975
-0.57
-0.59%
1 ene 1986 año
95.368
-0.607
-0.63%
1 ene 1987 año
94.67
-0.698
-0.73%
1 ene 1988 año
93.941
-0.729
-0.77%
1 ene 1989 año
92.865
-1.076
-1.15%
1 ene 1990 año
91.808
-1.057
-1.14%
1 ene 1991 año
90.814
-0.994
-1.08%
1 ene 1992 año
89.793
-1.021
-1.12%
1 ene 1993 año
88.75
-1.043
-1.16%
1 ene 1994 año
87.316
-1.434
-1.62%
1 ene 1995 año
85.825
-1.491
-1.71%
1 ene 1996 año
84.253
-1.572
-1.83%
1 ene 1997 año
82.577
-1.677
-1.99%
1 ene 1998 año
80.842
-1.735
-2.1%
1 ene 1999 año
79.185
-1.658
-2.05%
1 ene 2000 año
77.482
-1.703
-2.15%
1 ene 2001 año
75.722
-1.76
-2.27%
1 ene 2002 año
73.861
-1.861
-2.46%
1 ene 2003 año
71.988
-1.873
-2.54%
1 ene 2004 año
71.134
-0.853
-1.19%
1 ene 2005 año
70.344
-0.79
-1.11%
1 ene 2006 año
69.65
-0.694
-0.99%
1 ene 2007 año
68.993
-0.657
-0.94%
1 ene 2008 año
68.428
-0.565
-0.82%
1 ene 2009 año
68.29
-0.138
-0.2%
1 ene 2010 año
68.248
-0.042
-0.06%
1 ene 2011 año
68.262
+0.015
0.02%
1 ene 2012 año
68.356
+0.094
0.14%
1 ene 2013 año
68.55
+0.194
0.28%
1 ene 2014 año
68.003
-0.547
-0.8%
1 ene 2015 año
67.419
-0.584
-0.86%
1 ene 2016 año
66.774
-0.646
-0.96%
Ranking de los países por los datos estadísticos actuales


Comentarios: