29
/es/
es
AIzaSyAYiBZKx7MnpbEhh9jyipgxe19OcubqV5w
April 1, 2024
29637
Euro area
EMU
false
2
1
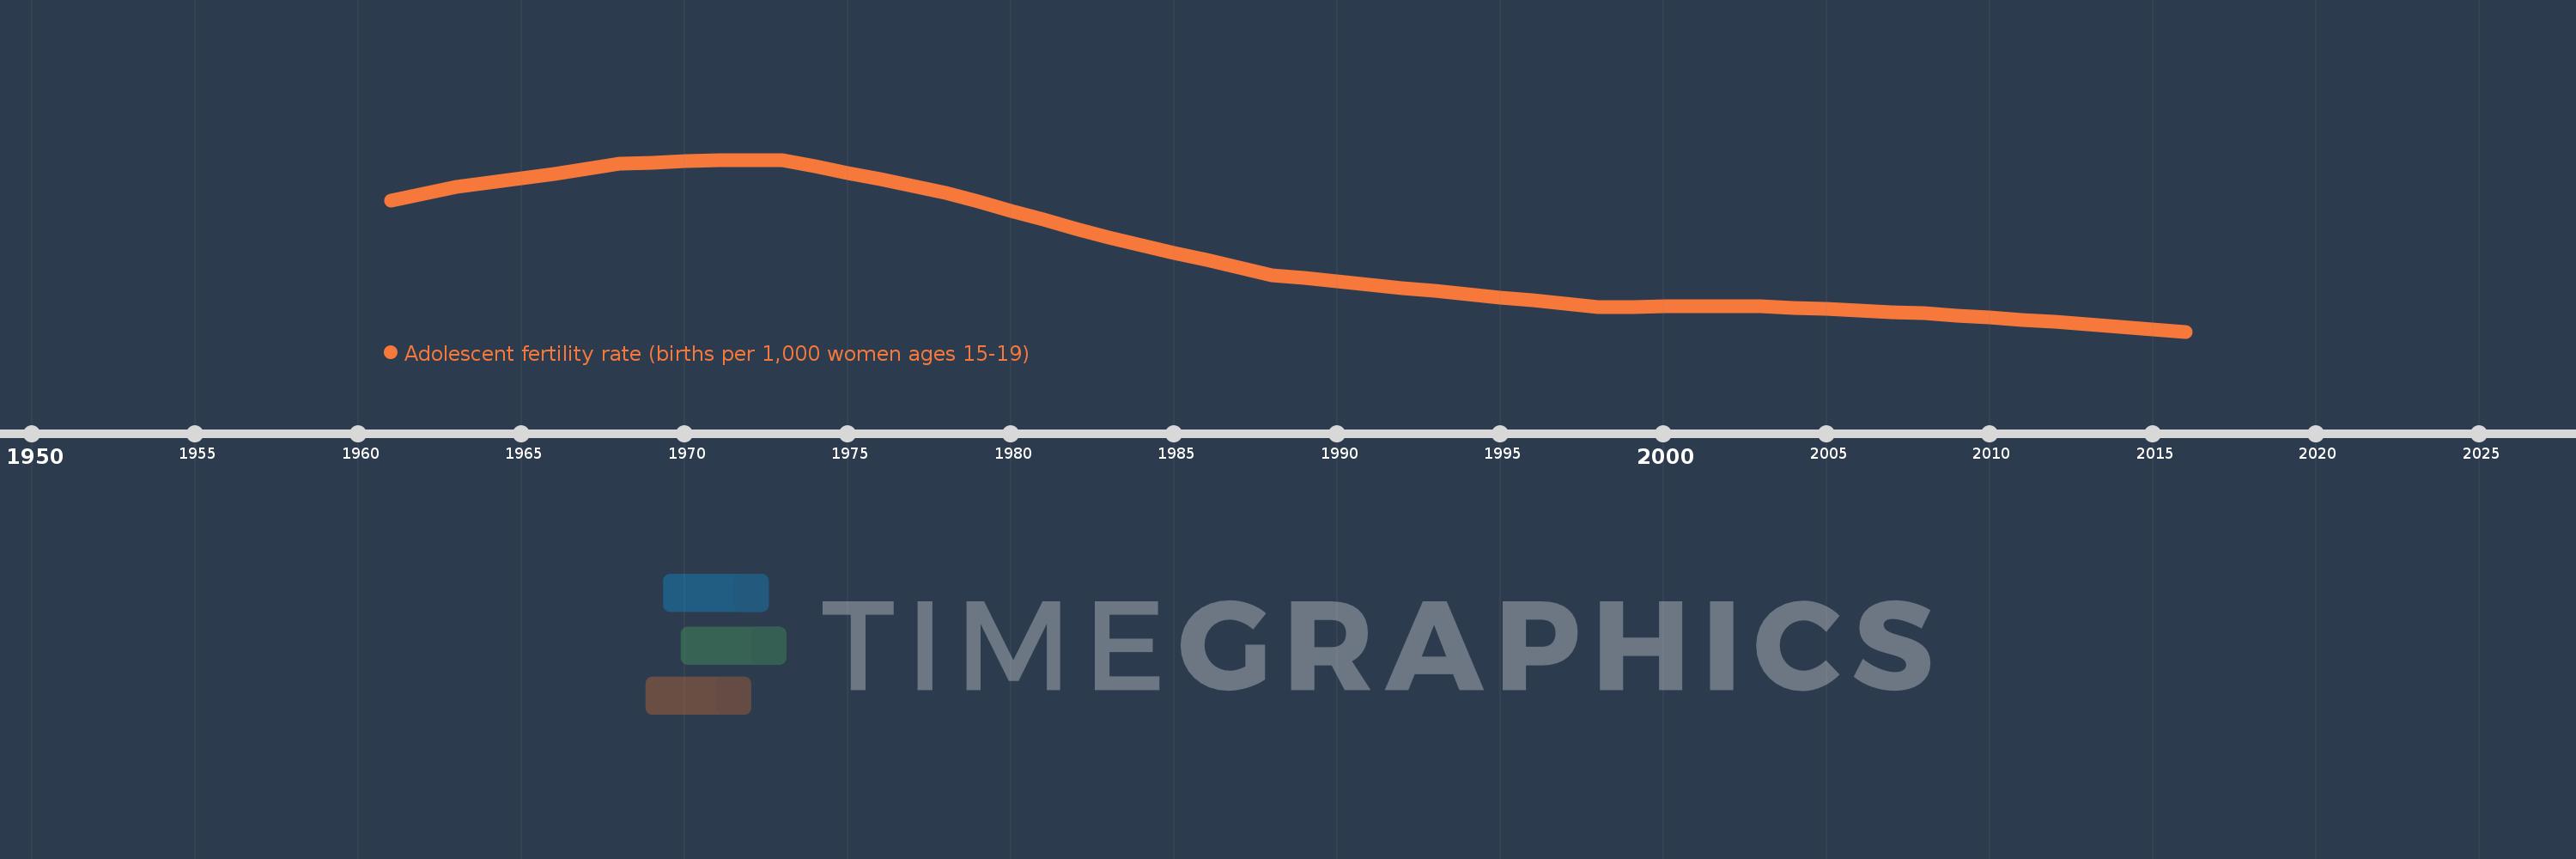
Adolescent fertility rate (births per 1,000 women ages 15-19)
2016,2015,2014,2013,2012,2011,2010,2009,2008,2007,2006,2005,2004,2003,2002,2001,2000,1999,1998,1997,1996,1995,1994,1993,1992,1991,1990,1989,1988,1987,1986,1985,1984,1983,1982,1981,1980,1979,1978,1977,1976,1975,1974,1973,1972,1971,1970,1969,1968,1967,1966,1965,1964,1963,1962,1961
Estas estadísticas en otros países:
AfghanistanAlbaniaAlgeriaAngolaAntigua and BarbudaArab WorldArgentinaArmeniaArubaAustraliaAustriaAzerbaijanBahamas, TheBahrainBangladeshBarbadosBelarusBelgiumBelizeBeninBhutanBoliviaBosnia and HerzegovinaBotswanaBrazilBrunei DarussalamBulgariaBurkina FasoBurundiCabo VerdeCambodiaCameroonCanadaCaribbean small statesCentral African RepublicCentral Europe and the BalticsChadChannel IslandsChileChinaColombiaComorosCongo, Dem. Rep.Congo, Rep.Costa RicaCote d'IvoireCroatiaCubaCuracaoCyprusCzech RepublicDenmarkDjiboutiDominican RepublicEarly-demographic dividendEast Asia & PacificEast Asia & Pacific (excluding high income)East Asia & Pacific (IDA & IBRD countries)EcuadorEgypt, Arab Rep.El SalvadorEquatorial GuineaEritreaEstoniaEthiopiaEuro areaEurope & Central AsiaEurope & Central Asia (excluding high income)Europe & Central Asia (IDA & IBRD countries)European UnionFijiFinlandFragile and conflict affected situationsFranceFrench PolynesiaGabonGambia, TheGeorgiaGermanyGhanaGreeceGrenadaGuamGuatemalaGuineaGuinea-BissauGuyanaHaitiHeavily indebted poor countries (HIPC)High incomeHondurasHong Kong SAR, ChinaHungaryIBRD onlyIcelandIDA & IBRD totalIDA blendIDA onlyIDA totalIndiaIndonesiaIran, Islamic Rep.IraqIrelandIsraelItalyJamaicaJapanJordanKazakhstanKenyaKiribatiKorea, Dem. People’s Rep.Korea, Rep.KuwaitKyrgyz RepublicLao PDRLate-demographic dividendLatin America & Caribbean Latin America & Caribbean (excluding high income)Latin America & the Caribbean (IDA & IBRD countries)LatviaLeast developed countries: UN classificationLebanonLesothoLiberiaLibyaLithuaniaLow & middle incomeLow incomeLower middle incomeLuxembourgMacao SAR, ChinaMacedonia, FYRMadagascarMalawiMalaysiaMaldivesMaliMaltaMauritaniaMauritiusMexicoMicronesia, Fed. Sts.Middle East & North AfricaMiddle East & North Africa (excluding high income)Middle East & North Africa (IDA & IBRD countries)Middle incomeMoldovaMongoliaMontenegroMoroccoMozambiqueMyanmarNamibiaNepalNetherlandsNew CaledoniaNew ZealandNicaraguaNigerNigeriaNorth AmericaNorwayOECD membersOmanOther small statesPacific island small statesPakistanPanamaPapua New GuineaParaguayPeruPhilippinesPolandPortugalPost-demographic dividendPre-demographic dividendPuerto RicoQatarRomaniaRussian FederationRwandaSamoaSao Tome and PrincipeSaudi ArabiaSenegalSerbiaSeychellesSierra LeoneSingaporeSlovak RepublicSloveniaSmall statesSolomon IslandsSomaliaSouth AfricaSouth AsiaSouth Asia (IDA & IBRD)South SudanSpainSri LankaSt. LuciaSt. Vincent and the GrenadinesSub-Saharan Africa Sub-Saharan Africa (excluding high income)Sub-Saharan Africa (IDA & IBRD countries)SudanSurinameSwazilandSwedenSwitzerlandSyrian Arab RepublicTajikistanTanzaniaThailandTimor-LesteTogoTongaTrinidad and TobagoTunisiaTurkeyTurkmenistanUgandaUkraineUnited Arab EmiratesUnited KingdomUnited StatesUpper middle incomeUruguayUzbekistanVanuatuVenezuela, RBVietnamVirgin Islands (U.S.)West Bank and GazaWorldYemen, Rep.ZambiaZimbabwe línea de tiempo (timeline):
En esta escala de tiempo se presenta un gráfico de 1961 y 2016 de Euro area. Los datos de 1960 están ausentes. El número de observaciones reales por fecha: 56.
Fuente (nombre):
Indicadores del desarrollo mundial
Fuente (organización):
United Nations Population Division, World Population Prospects.
Categorías:
Health, Gender, Social Development
Se ha actualizado:
23 abr 2017 año
Los indicadores de los cambios de valor en los últimos años
Mínimo:
7.512
1 ene 2016 año
Máximo:
33.51
1 ene 1973 año
A la fecha de observación
Valor
Cambio absoluto
El cambio con respecto al valor anterior
1 ene 1961 año
27.302
+27.302
0.0%
1 ene 1962 año
28.378
+1.076
3.94%
1 ene 1963 año
29.42
+1.043
3.67%
1 ene 1964 año
30.061
+0.641
2.18%
1 ene 1965 año
30.707
+0.646
2.15%
1 ene 1966 año
31.392
+0.684
2.23%
1 ene 1967 año
32.129
+0.737
2.35%
1 ene 1968 año
32.912
+0.784
2.44%
1 ene 1969 año
33.106
+0.194
0.59%
1 ene 1970 año
33.283
+0.176
0.53%
1 ene 1971 año
33.382
+0.1
0.3%
1 ene 1972 año
33.458
+0.075
0.23%
1 ene 1973 año
33.51
+0.053
0.16%
1 ene 1974 año
32.52
-0.99
-2.95%
1 ene 1975 año
31.52
-1.001
-3.08%
1 ene 1976 año
30.521
-0.999
-3.17%
1 ene 1977 año
29.53
-0.99
-3.24%
1 ene 1978 año
28.528
-1.002
-3.39%
1 ene 1979 año
27.169
-1.36
-4.77%
1 ene 1980 año
25.81
-1.359
-5.0%
1 ene 1981 año
24.454
-1.355
-5.25%
1 ene 1982 año
23.1
-1.354
-5.54%
1 ene 1983 año
21.752
-1.349
-5.84%
1 ene 1984 año
20.607
-1.144
-5.26%
1 ene 1985 año
19.462
-1.145
-5.56%
1 ene 1986 año
18.317
-1.145
-5.88%
1 ene 1987 año
17.19
-1.127
-6.15%
1 ene 1988 año
16.071
-1.119
-6.51%
1 ene 1989 año
15.584
-0.486
-3.03%
1 ene 1990 año
15.095
-0.489
-3.14%
1 ene 1991 año
14.606
-0.49
-3.25%
1 ene 1992 año
14.118
-0.488
-3.34%
1 ene 1993 año
13.628
-0.49
-3.47%
1 ene 1994 año
13.163
-0.465
-3.41%
1 ene 1995 año
12.692
-0.471
-3.58%
1 ene 1996 año
12.211
-0.481
-3.79%
1 ene 1997 año
11.72
-0.492
-4.03%
1 ene 1998 año
11.221
-0.499
-4.26%
1 ene 1999 año
11.264
+0.043
0.39%
1 ene 2000 año
11.298
+0.034
0.3%
1 ene 2001 año
11.321
+0.023
0.2%
1 ene 2002 año
11.326
+0.005
0.04%
1 ene 2003 año
11.322
-0.003
-0.03%
1 ene 2004 año
11.126
-0.197
-1.74%
1 ene 2005 año
10.92
-0.205
-1.85%
1 ene 2006 año
10.711
-0.209
-1.91%
1 ene 2007 año
10.5
-0.211
-1.97%
1 ene 2008 año
10.292
-0.208
-1.98%
1 ene 2009 año
9.956
-0.336
-3.27%
1 ene 2010 año
9.62
-0.336
-3.38%
1 ene 2011 año
9.284
-0.336
-3.49%
1 ene 2012 año
8.945
-0.339
-3.65%
1 ene 2013 año
8.611
-0.334
-3.74%
1 ene 2014 año
8.233
-0.378
-4.39%
1 ene 2015 año
7.869
-0.364
-4.42%
1 ene 2016 año
7.512
-0.357
-4.54%
Ranking de los países por los datos estadísticos actuales


Comentarios: