29
/es/
es
AIzaSyAYiBZKx7MnpbEhh9jyipgxe19OcubqV5w
April 1, 2024
206363
Nepal
NPL
true
2
1
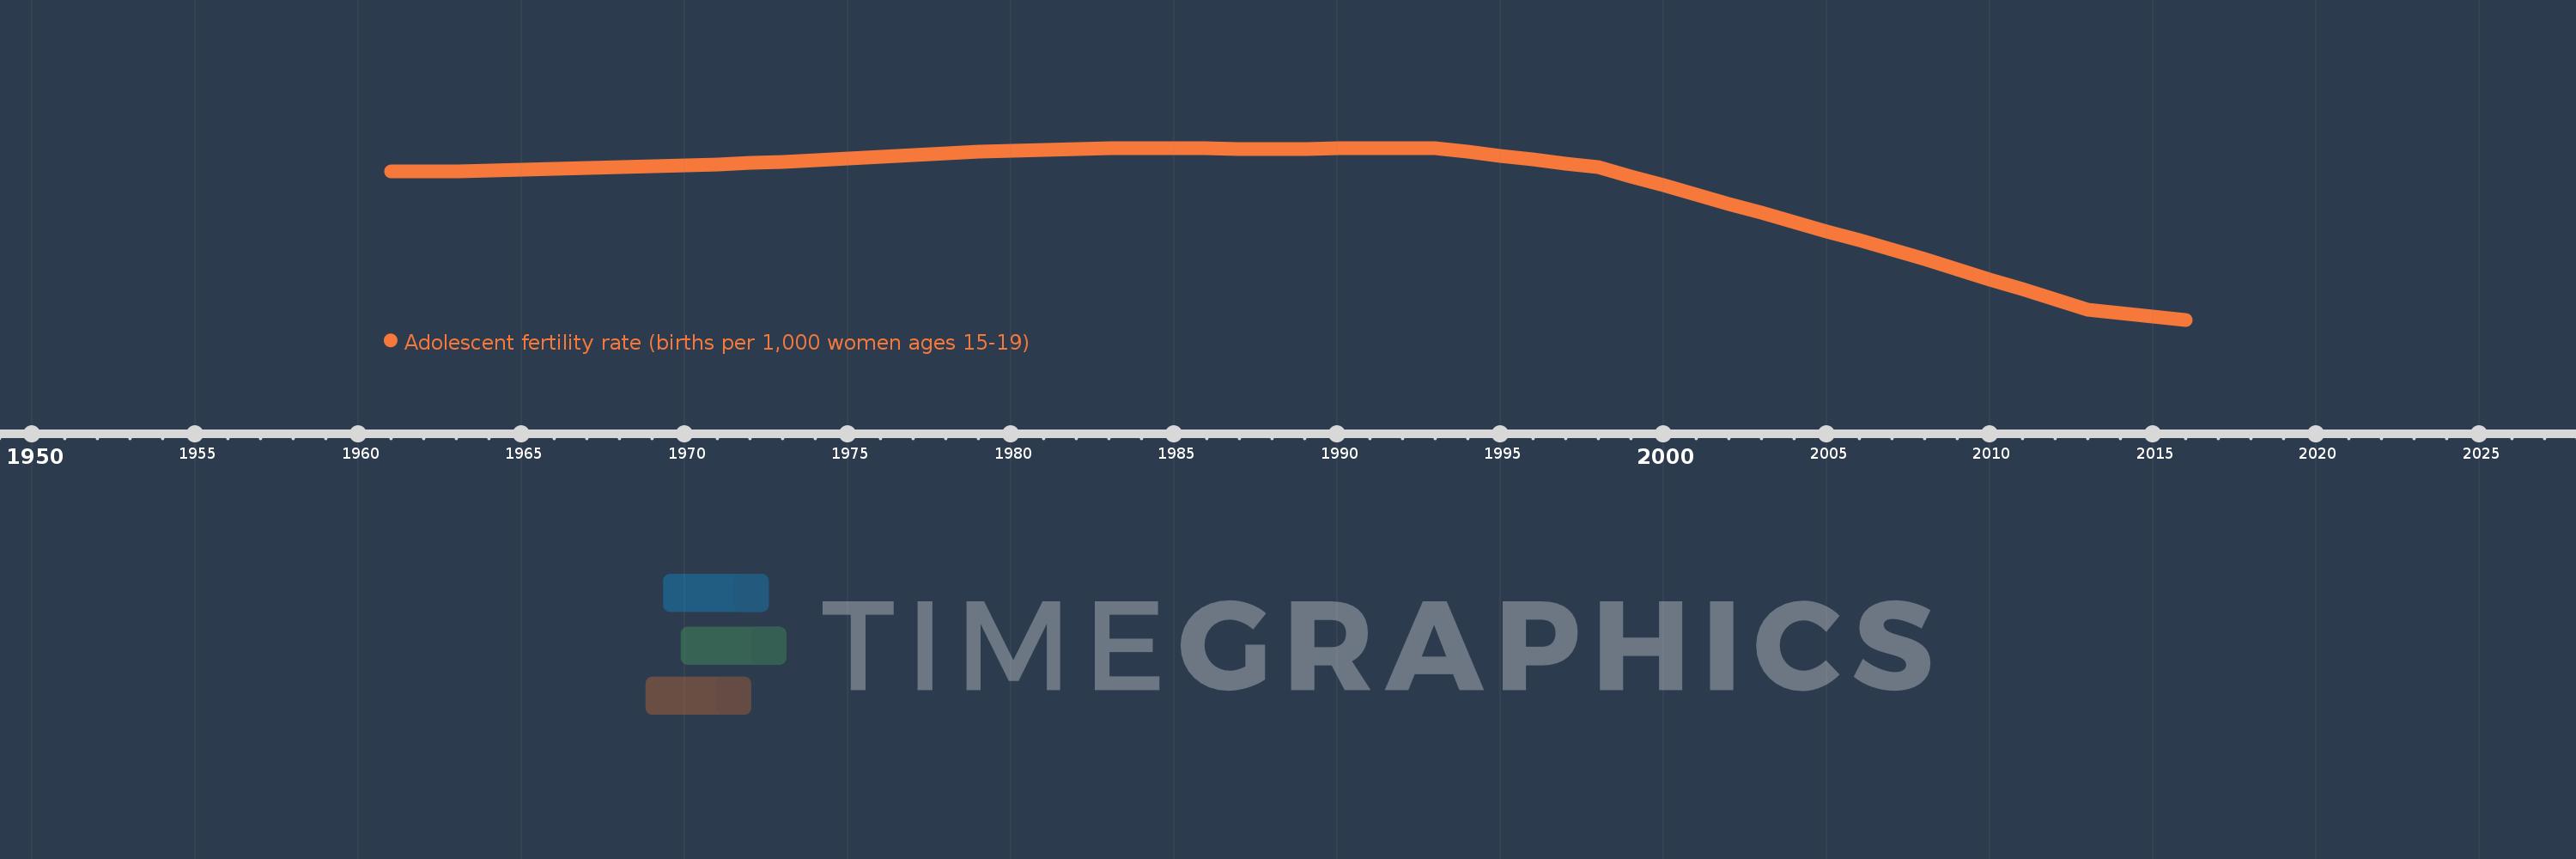
Adolescent fertility rate (births per 1,000 women ages 15-19)
2016,2015,2014,2013,2012,2011,2010,2009,2008,2007,2006,2005,2004,2003,2002,2001,2000,1999,1998,1997,1996,1995,1994,1993,1992,1991,1990,1989,1988,1987,1986,1985,1984,1983,1982,1981,1980,1979,1978,1977,1976,1975,1974,1973,1972,1971,1970,1969,1968,1967,1966,1965,1964,1963,1962,1961
Estas estadísticas en otros países:
AfghanistanAlbaniaAlgeriaAngolaAntigua and BarbudaArab WorldArgentinaArmeniaArubaAustraliaAustriaAzerbaijanBahamas, TheBahrainBangladeshBarbadosBelarusBelgiumBelizeBeninBhutanBoliviaBosnia and HerzegovinaBotswanaBrazilBrunei DarussalamBulgariaBurkina FasoBurundiCabo VerdeCambodiaCameroonCanadaCaribbean small statesCentral African RepublicCentral Europe and the BalticsChadChannel IslandsChileChinaColombiaComorosCongo, Dem. Rep.Congo, Rep.Costa RicaCote d'IvoireCroatiaCubaCuracaoCyprusCzech RepublicDenmarkDjiboutiDominican RepublicEarly-demographic dividendEast Asia & PacificEast Asia & Pacific (excluding high income)East Asia & Pacific (IDA & IBRD countries)EcuadorEgypt, Arab Rep.El SalvadorEquatorial GuineaEritreaEstoniaEthiopiaEuro areaEurope & Central AsiaEurope & Central Asia (excluding high income)Europe & Central Asia (IDA & IBRD countries)European UnionFijiFinlandFragile and conflict affected situationsFranceFrench PolynesiaGabonGambia, TheGeorgiaGermanyGhanaGreeceGrenadaGuamGuatemalaGuineaGuinea-BissauGuyanaHaitiHeavily indebted poor countries (HIPC)High incomeHondurasHong Kong SAR, ChinaHungaryIBRD onlyIcelandIDA & IBRD totalIDA blendIDA onlyIDA totalIndiaIndonesiaIran, Islamic Rep.IraqIrelandIsraelItalyJamaicaJapanJordanKazakhstanKenyaKiribatiKorea, Dem. People’s Rep.Korea, Rep.KuwaitKyrgyz RepublicLao PDRLate-demographic dividendLatin America & Caribbean Latin America & Caribbean (excluding high income)Latin America & the Caribbean (IDA & IBRD countries)LatviaLeast developed countries: UN classificationLebanonLesothoLiberiaLibyaLithuaniaLow & middle incomeLow incomeLower middle incomeLuxembourgMacao SAR, ChinaMacedonia, FYRMadagascarMalawiMalaysiaMaldivesMaliMaltaMauritaniaMauritiusMexicoMicronesia, Fed. Sts.Middle East & North AfricaMiddle East & North Africa (excluding high income)Middle East & North Africa (IDA & IBRD countries)Middle incomeMoldovaMongoliaMontenegroMoroccoMozambiqueMyanmarNamibiaNepalNetherlandsNew CaledoniaNew ZealandNicaraguaNigerNigeriaNorth AmericaNorwayOECD membersOmanOther small statesPacific island small statesPakistanPanamaPapua New GuineaParaguayPeruPhilippinesPolandPortugalPost-demographic dividendPre-demographic dividendPuerto RicoQatarRomaniaRussian FederationRwandaSamoaSao Tome and PrincipeSaudi ArabiaSenegalSerbiaSeychellesSierra LeoneSingaporeSlovak RepublicSloveniaSmall statesSolomon IslandsSomaliaSouth AfricaSouth AsiaSouth Asia (IDA & IBRD)South SudanSpainSri LankaSt. LuciaSt. Vincent and the GrenadinesSub-Saharan Africa Sub-Saharan Africa (excluding high income)Sub-Saharan Africa (IDA & IBRD countries)SudanSurinameSwazilandSwedenSwitzerlandSyrian Arab RepublicTajikistanTanzaniaThailandTimor-LesteTogoTongaTrinidad and TobagoTunisiaTurkeyTurkmenistanUgandaUkraineUnited Arab EmiratesUnited KingdomUnited StatesUpper middle incomeUruguayUzbekistanVanuatuVenezuela, RBVietnamVirgin Islands (U.S.)West Bank and GazaWorldYemen, Rep.ZambiaZimbabwe línea de tiempo (timeline):
En esta escala de tiempo se presenta un gráfico de 1961 y 2016 de Nepal. Los datos de 1960 están ausentes. El número de observaciones reales por fecha: 56.
Fuente (nombre):
Indicadores del desarrollo mundial
Fuente (organización):
United Nations Population Division, World Population Prospects.
Categorías:
Health, Gender, Social Development
Se ha actualizado:
23 abr 2017 año
Los indicadores de los cambios de valor en los últimos años
Mínimo:
71.288
1 ene 2016 año
Máximo:
135.077
1 ene 1983 año
A la fecha de observación
Valor
Cambio absoluto
El cambio con respecto al valor anterior
1 ene 1961 año
126.29
+126.29
0.0%
1 ene 1962 año
126.29
0.0
0.0%
1 ene 1963 año
126.29
0.0
0.0%
1 ene 1964 año
126.619
+0.329
0.26%
1 ene 1965 año
126.948
+0.329
0.26%
1 ene 1966 año
127.277
+0.329
0.26%
1 ene 1967 año
127.606
+0.329
0.26%
1 ene 1968 año
127.935
+0.329
0.26%
1 ene 1969 año
128.316
+0.381
0.3%
1 ene 1970 año
128.698
+0.381
0.3%
1 ene 1971 año
129.079
+0.381
0.3%
1 ene 1972 año
129.461
+0.381
0.3%
1 ene 1973 año
129.842
+0.381
0.29%
1 ene 1974 año
130.518
+0.676
0.52%
1 ene 1975 año
131.193
+0.676
0.52%
1 ene 1976 año
131.869
+0.676
0.51%
1 ene 1977 año
132.544
+0.676
0.51%
1 ene 1978 año
133.22
+0.676
0.51%
1 ene 1979 año
133.591
+0.371
0.28%
1 ene 1980 año
133.963
+0.371
0.28%
1 ene 1981 año
134.334
+0.371
0.28%
1 ene 1982 año
134.706
+0.371
0.28%
1 ene 1983 año
135.077
+0.371
0.28%
1 ene 1984 año
135.011
-0.066
-0.05%
1 ene 1985 año
134.944
-0.066
-0.05%
1 ene 1986 año
134.878
-0.066
-0.05%
1 ene 1987 año
134.811
-0.066
-0.05%
1 ene 1988 año
134.745
-0.066
-0.05%
1 ene 1989 año
134.811
+0.066
0.05%
1 ene 1990 año
134.878
+0.066
0.05%
1 ene 1991 año
134.944
+0.066
0.05%
1 ene 1992 año
135.011
+0.066
0.05%
1 ene 1993 año
135.077
+0.066
0.05%
1 ene 1994 año
133.634
-1.443
-1.07%
1 ene 1995 año
132.191
-1.443
-1.08%
1 ene 1996 año
130.749
-1.443
-1.09%
1 ene 1997 año
129.306
-1.443
-1.1%
1 ene 1998 año
127.863
-1.443
-1.12%
1 ene 1999 año
124.49
-3.373
-2.64%
1 ene 2000 año
121.116
-3.373
-2.71%
1 ene 2001 año
117.743
-3.373
-2.79%
1 ene 2002 año
114.369
-3.373
-2.87%
1 ene 2003 año
110.996
-3.373
-2.95%
1 ene 2004 año
107.563
-3.433
-3.09%
1 ene 2005 año
104.13
-3.433
-3.19%
1 ene 2006 año
100.698
-3.433
-3.3%
1 ene 2007 año
97.265
-3.433
-3.41%
1 ene 2008 año
93.832
-3.433
-3.53%
1 ene 2009 año
90.066
-3.766
-4.01%
1 ene 2010 año
86.301
-3.766
-4.18%
1 ene 2011 año
82.535
-3.766
-4.36%
1 ene 2012 año
78.77
-3.766
-4.56%
1 ene 2013 año
75.004
-3.766
-4.78%
1 ene 2014 año
73.765
-1.239
-1.65%
1 ene 2015 año
72.527
-1.239
-1.68%
1 ene 2016 año
71.288
-1.239
-1.71%
Ranking de los países por los datos estadísticos actuales


Comentarios: