29
/es/
es
AIzaSyAYiBZKx7MnpbEhh9jyipgxe19OcubqV5w
April 1, 2024
198710
Mongolia
MNG
true
2
1
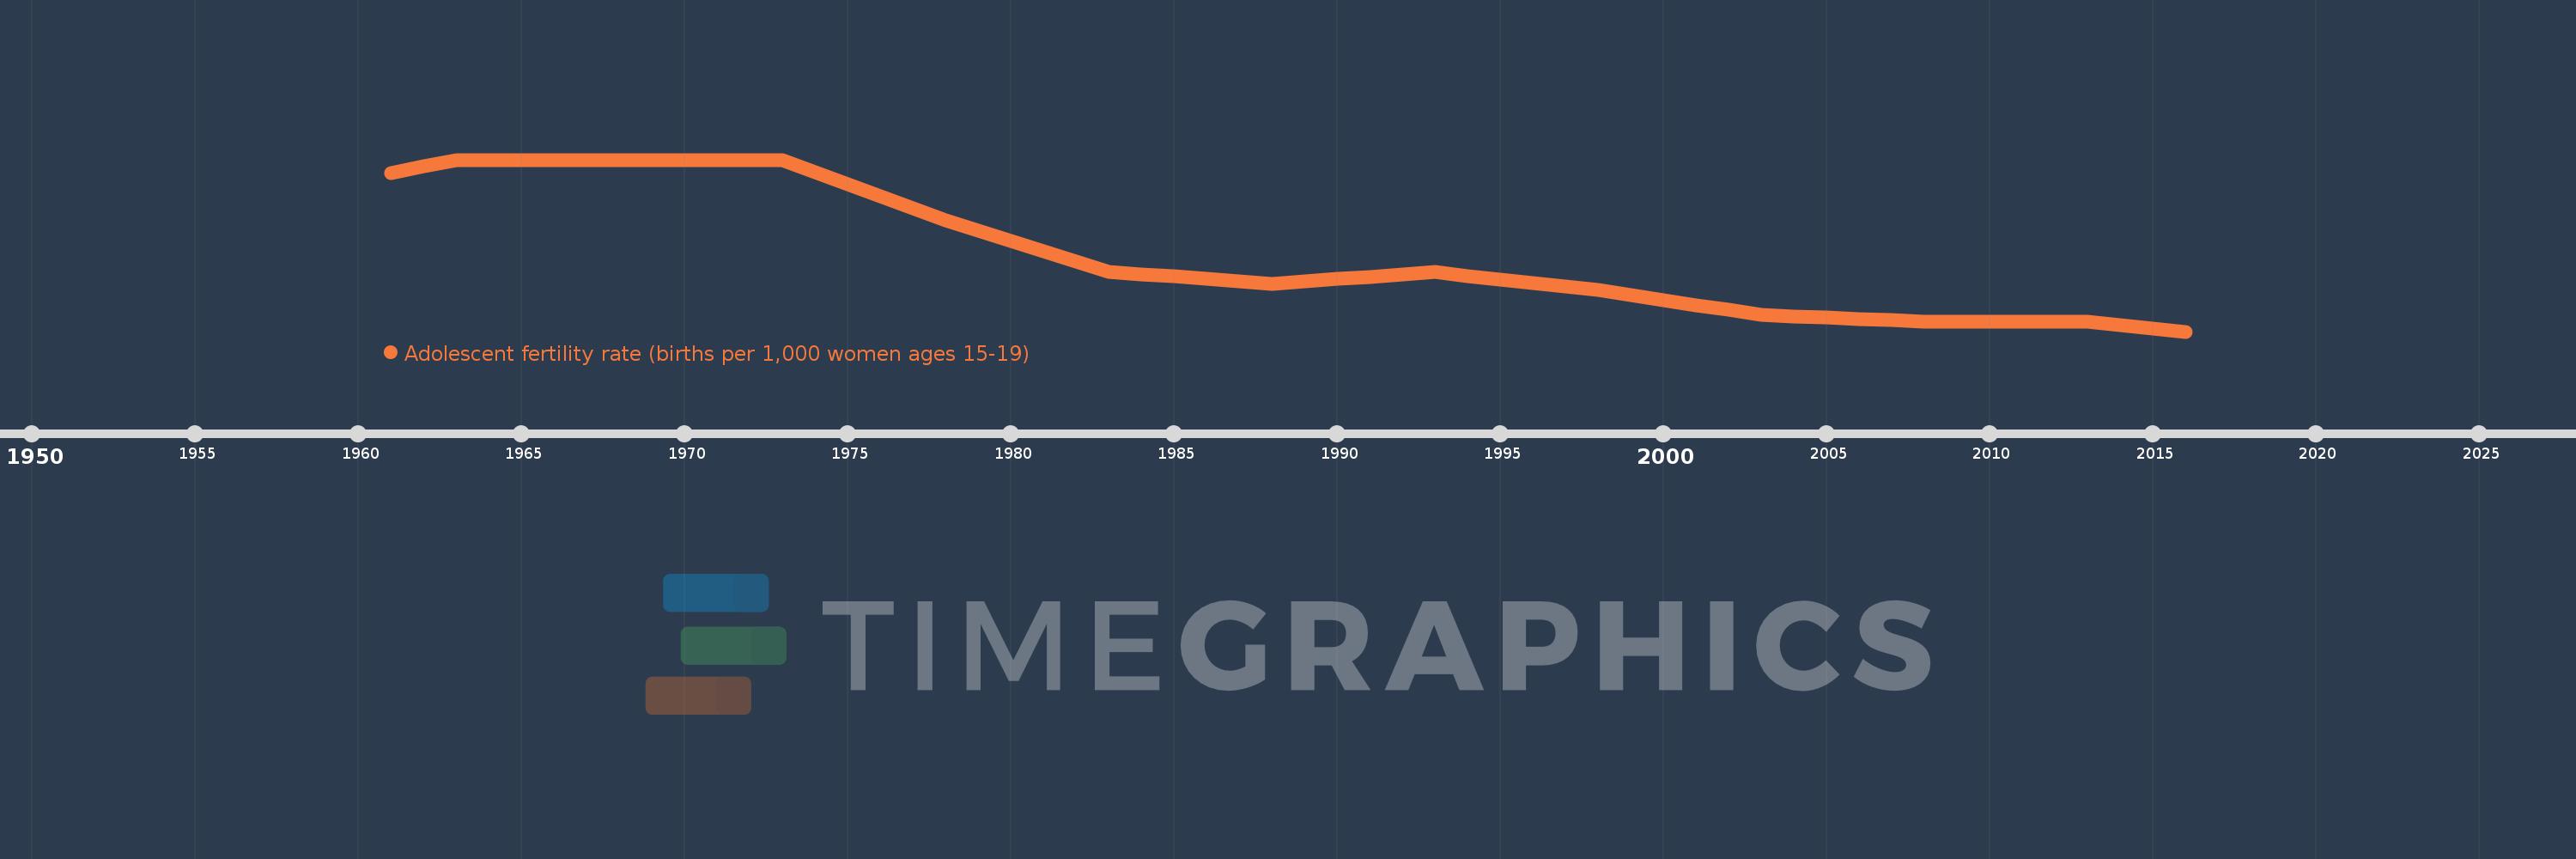
Adolescent fertility rate (births per 1,000 women ages 15-19)
2016,2015,2014,2013,2012,2011,2010,2009,2008,2007,2006,2005,2004,2003,2002,2001,2000,1999,1998,1997,1996,1995,1994,1993,1992,1991,1990,1989,1988,1987,1986,1985,1984,1983,1982,1981,1980,1979,1978,1977,1976,1975,1974,1973,1972,1971,1970,1969,1968,1967,1966,1965,1964,1963,1962,1961
Estas estadísticas en otros países:
AfghanistanAlbaniaAlgeriaAngolaAntigua and BarbudaArab WorldArgentinaArmeniaArubaAustraliaAustriaAzerbaijanBahamas, TheBahrainBangladeshBarbadosBelarusBelgiumBelizeBeninBhutanBoliviaBosnia and HerzegovinaBotswanaBrazilBrunei DarussalamBulgariaBurkina FasoBurundiCabo VerdeCambodiaCameroonCanadaCaribbean small statesCentral African RepublicCentral Europe and the BalticsChadChannel IslandsChileChinaColombiaComorosCongo, Dem. Rep.Congo, Rep.Costa RicaCote d'IvoireCroatiaCubaCuracaoCyprusCzech RepublicDenmarkDjiboutiDominican RepublicEarly-demographic dividendEast Asia & PacificEast Asia & Pacific (excluding high income)East Asia & Pacific (IDA & IBRD countries)EcuadorEgypt, Arab Rep.El SalvadorEquatorial GuineaEritreaEstoniaEthiopiaEuro areaEurope & Central AsiaEurope & Central Asia (excluding high income)Europe & Central Asia (IDA & IBRD countries)European UnionFijiFinlandFragile and conflict affected situationsFranceFrench PolynesiaGabonGambia, TheGeorgiaGermanyGhanaGreeceGrenadaGuamGuatemalaGuineaGuinea-BissauGuyanaHaitiHeavily indebted poor countries (HIPC)High incomeHondurasHong Kong SAR, ChinaHungaryIBRD onlyIcelandIDA & IBRD totalIDA blendIDA onlyIDA totalIndiaIndonesiaIran, Islamic Rep.IraqIrelandIsraelItalyJamaicaJapanJordanKazakhstanKenyaKiribatiKorea, Dem. People’s Rep.Korea, Rep.KuwaitKyrgyz RepublicLao PDRLate-demographic dividendLatin America & Caribbean Latin America & Caribbean (excluding high income)Latin America & the Caribbean (IDA & IBRD countries)LatviaLeast developed countries: UN classificationLebanonLesothoLiberiaLibyaLithuaniaLow & middle incomeLow incomeLower middle incomeLuxembourgMacao SAR, ChinaMacedonia, FYRMadagascarMalawiMalaysiaMaldivesMaliMaltaMauritaniaMauritiusMexicoMicronesia, Fed. Sts.Middle East & North AfricaMiddle East & North Africa (excluding high income)Middle East & North Africa (IDA & IBRD countries)Middle incomeMoldovaMongoliaMontenegroMoroccoMozambiqueMyanmarNamibiaNepalNetherlandsNew CaledoniaNew ZealandNicaraguaNigerNigeriaNorth AmericaNorwayOECD membersOmanOther small statesPacific island small statesPakistanPanamaPapua New GuineaParaguayPeruPhilippinesPolandPortugalPost-demographic dividendPre-demographic dividendPuerto RicoQatarRomaniaRussian FederationRwandaSamoaSao Tome and PrincipeSaudi ArabiaSenegalSerbiaSeychellesSierra LeoneSingaporeSlovak RepublicSloveniaSmall statesSolomon IslandsSomaliaSouth AfricaSouth AsiaSouth Asia (IDA & IBRD)South SudanSpainSri LankaSt. LuciaSt. Vincent and the GrenadinesSub-Saharan Africa Sub-Saharan Africa (excluding high income)Sub-Saharan Africa (IDA & IBRD countries)SudanSurinameSwazilandSwedenSwitzerlandSyrian Arab RepublicTajikistanTanzaniaThailandTimor-LesteTogoTongaTrinidad and TobagoTunisiaTurkeyTurkmenistanUgandaUkraineUnited Arab EmiratesUnited KingdomUnited StatesUpper middle incomeUruguayUzbekistanVanuatuVenezuela, RBVietnamVirgin Islands (U.S.)West Bank and GazaWorldYemen, Rep.ZambiaZimbabwe línea de tiempo (timeline):
En esta escala de tiempo se presenta un gráfico de 1961 y 2016 de Mongolia. Los datos de 1960 están ausentes. El número de observaciones reales por fecha: 56.
Fuente (nombre):
Indicadores del desarrollo mundial
Fuente (organización):
United Nations Population Division, World Population Prospects.
Categorías:
Health, Gender, Social Development
Se ha actualizado:
23 abr 2017 año
Los indicadores de los cambios de valor en los últimos años
Mínimo:
15.002
1 ene 2016 año
Máximo:
82.801
1 ene 1963 año
A la fecha de observación
Valor
Cambio absoluto
El cambio con respecto al valor anterior
1 ene 1961 año
77.502
+77.502
0.0%
1 ene 1962 año
80.151
+2.65
3.42%
1 ene 1963 año
82.801
+2.65
3.31%
1 ene 1964 año
82.801
0.0
0.0%
1 ene 1965 año
82.801
0.0
0.0%
1 ene 1966 año
82.801
0.0
0.0%
1 ene 1967 año
82.801
0.0
0.0%
1 ene 1968 año
82.801
0.0
0.0%
1 ene 1969 año
82.801
0.0
0.0%
1 ene 1970 año
82.801
0.0
0.0%
1 ene 1971 año
82.801
0.0
0.0%
1 ene 1972 año
82.801
0.0
0.0%
1 ene 1973 año
82.801
0.0
0.0%
1 ene 1974 año
78.051
-4.75
-5.74%
1 ene 1975 año
73.301
-4.75
-6.09%
1 ene 1976 año
68.552
-4.75
-6.48%
1 ene 1977 año
63.802
-4.75
-6.93%
1 ene 1978 año
59.052
-4.75
-7.44%
1 ene 1979 año
54.97
-4.082
-6.91%
1 ene 1980 año
50.887
-4.082
-7.43%
1 ene 1981 año
46.805
-4.082
-8.02%
1 ene 1982 año
42.722
-4.082
-8.72%
1 ene 1983 año
38.64
-4.082
-9.56%
1 ene 1984 año
37.689
-0.951
-2.46%
1 ene 1985 año
36.738
-0.951
-2.52%
1 ene 1986 año
35.787
-0.951
-2.59%
1 ene 1987 año
34.836
-0.951
-2.66%
1 ene 1988 año
33.885
-0.951
-2.73%
1 ene 1989 año
34.792
+0.907
2.68%
1 ene 1990 año
35.699
+0.907
2.61%
1 ene 1991 año
36.607
+0.907
2.54%
1 ene 1992 año
37.514
+0.907
2.48%
1 ene 1993 año
38.421
+0.907
2.42%
1 ene 1994 año
37.023
-1.398
-3.64%
1 ene 1995 año
35.625
-1.398
-3.78%
1 ene 1996 año
34.228
-1.398
-3.92%
1 ene 1997 año
32.83
-1.398
-4.08%
1 ene 1998 año
31.432
-1.398
-4.26%
1 ene 1999 año
29.455
-1.977
-6.29%
1 ene 2000 año
27.478
-1.977
-6.71%
1 ene 2001 año
25.502
-1.977
-7.19%
1 ene 2002 año
23.525
-1.977
-7.75%
1 ene 2003 año
21.548
-1.977
-8.4%
1 ene 2004 año
21.045
-0.503
-2.34%
1 ene 2005 año
20.542
-0.503
-2.39%
1 ene 2006 año
20.038
-0.503
-2.45%
1 ene 2007 año
19.535
-0.503
-2.51%
1 ene 2008 año
19.032
-0.503
-2.58%
1 ene 2009 año
19.032
0.0
0.0%
1 ene 2010 año
19.031
0.0
0.0%
1 ene 2011 año
19.031
0.0
0.0%
1 ene 2012 año
19.03
0.0
0.0%
1 ene 2013 año
19.03
0.0
0.0%
1 ene 2014 año
17.687
-1.343
-7.06%
1 ene 2015 año
16.345
-1.343
-7.59%
1 ene 2016 año
15.002
-1.343
-8.21%
Ranking de los países por los datos estadísticos actuales


Comentarios: