29
/es/
es
AIzaSyAYiBZKx7MnpbEhh9jyipgxe19OcubqV5w
April 1, 2024
240189
Singapore
SGP
true
2
1
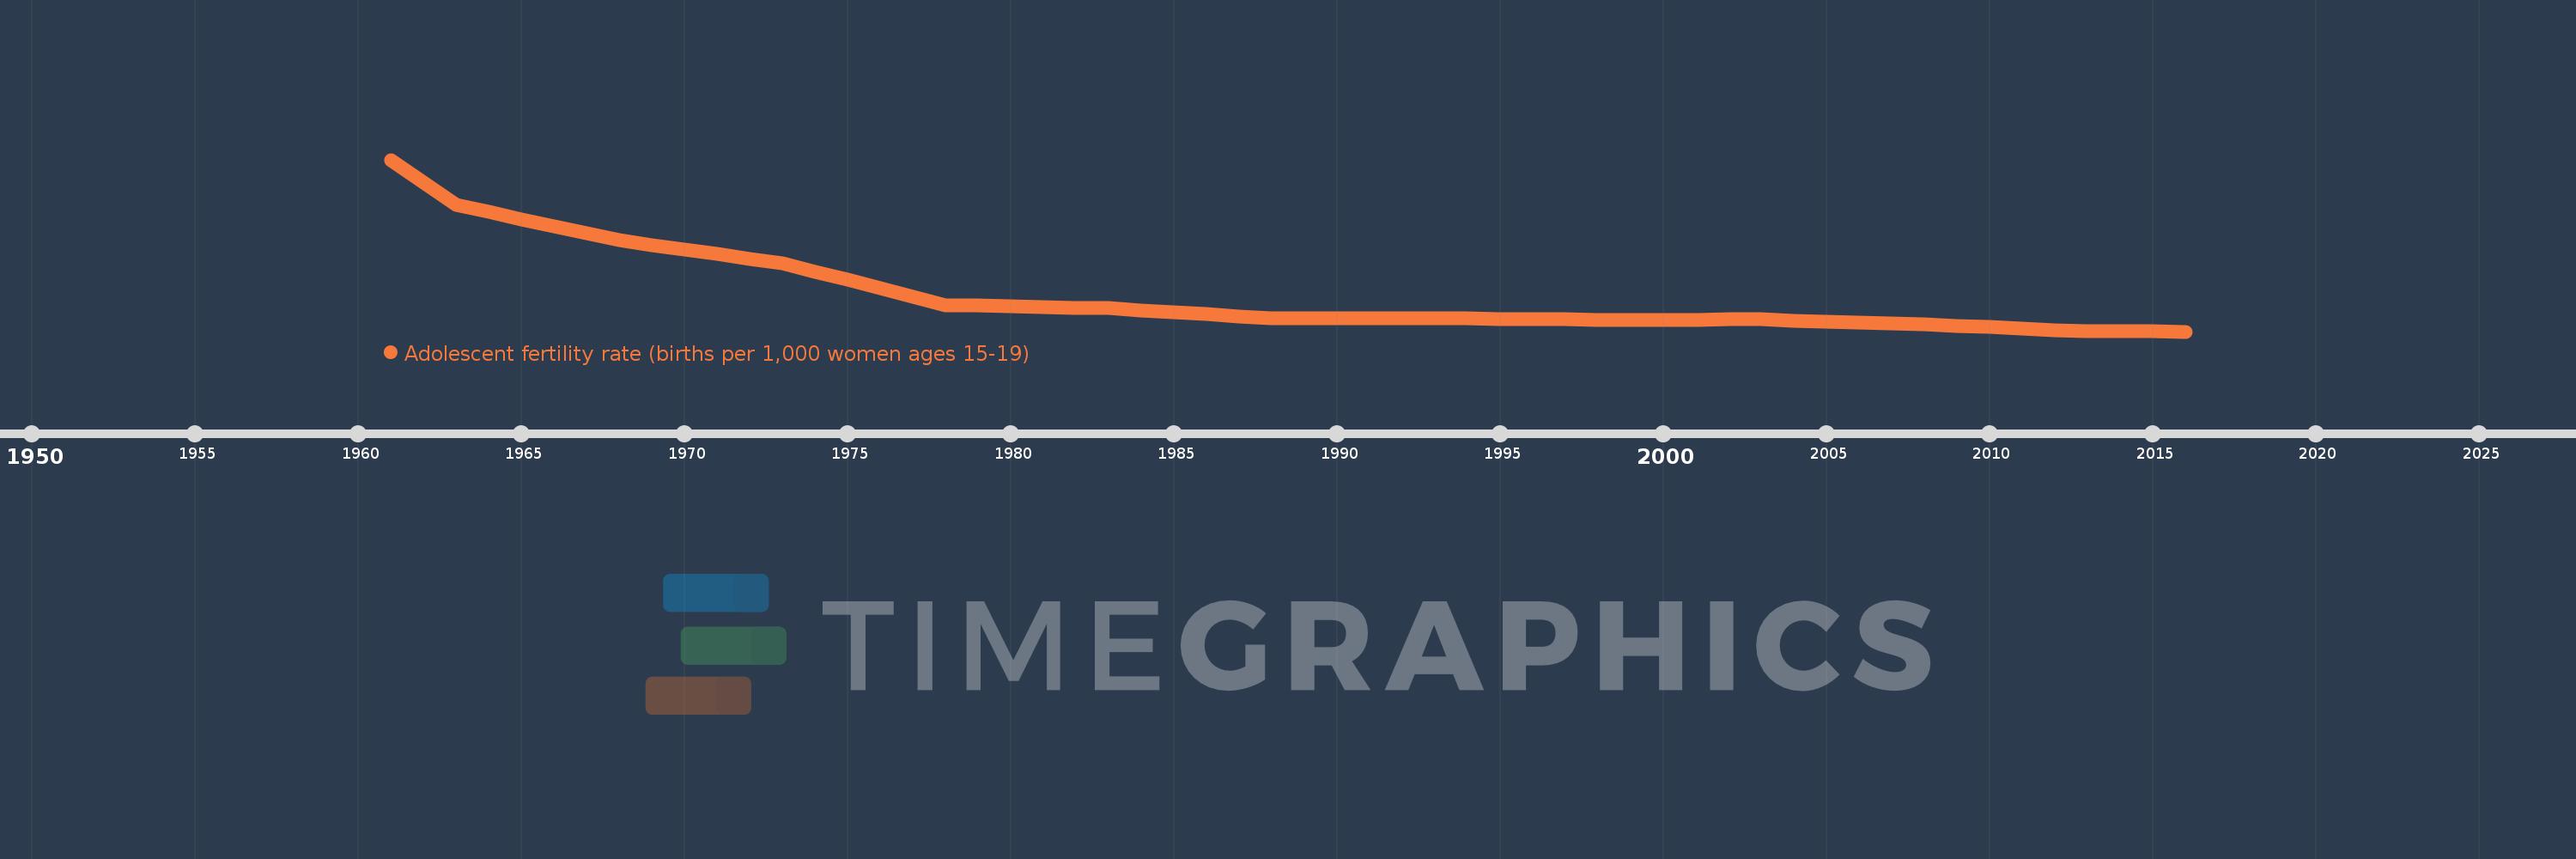
Adolescent fertility rate (births per 1,000 women ages 15-19)
2016,2015,2014,2013,2012,2011,2010,2009,2008,2007,2006,2005,2004,2003,2002,2001,2000,1999,1998,1997,1996,1995,1994,1993,1992,1991,1990,1989,1988,1987,1986,1985,1984,1983,1982,1981,1980,1979,1978,1977,1976,1975,1974,1973,1972,1971,1970,1969,1968,1967,1966,1965,1964,1963,1962,1961
Estas estadísticas en otros países:
AfghanistanAlbaniaAlgeriaAngolaAntigua and BarbudaArab WorldArgentinaArmeniaArubaAustraliaAustriaAzerbaijanBahamas, TheBahrainBangladeshBarbadosBelarusBelgiumBelizeBeninBhutanBoliviaBosnia and HerzegovinaBotswanaBrazilBrunei DarussalamBulgariaBurkina FasoBurundiCabo VerdeCambodiaCameroonCanadaCaribbean small statesCentral African RepublicCentral Europe and the BalticsChadChannel IslandsChileChinaColombiaComorosCongo, Dem. Rep.Congo, Rep.Costa RicaCote d'IvoireCroatiaCubaCuracaoCyprusCzech RepublicDenmarkDjiboutiDominican RepublicEarly-demographic dividendEast Asia & PacificEast Asia & Pacific (excluding high income)East Asia & Pacific (IDA & IBRD countries)EcuadorEgypt, Arab Rep.El SalvadorEquatorial GuineaEritreaEstoniaEthiopiaEuro areaEurope & Central AsiaEurope & Central Asia (excluding high income)Europe & Central Asia (IDA & IBRD countries)European UnionFijiFinlandFragile and conflict affected situationsFranceFrench PolynesiaGabonGambia, TheGeorgiaGermanyGhanaGreeceGrenadaGuamGuatemalaGuineaGuinea-BissauGuyanaHaitiHeavily indebted poor countries (HIPC)High incomeHondurasHong Kong SAR, ChinaHungaryIBRD onlyIcelandIDA & IBRD totalIDA blendIDA onlyIDA totalIndiaIndonesiaIran, Islamic Rep.IraqIrelandIsraelItalyJamaicaJapanJordanKazakhstanKenyaKiribatiKorea, Dem. People’s Rep.Korea, Rep.KuwaitKyrgyz RepublicLao PDRLate-demographic dividendLatin America & Caribbean Latin America & Caribbean (excluding high income)Latin America & the Caribbean (IDA & IBRD countries)LatviaLeast developed countries: UN classificationLebanonLesothoLiberiaLibyaLithuaniaLow & middle incomeLow incomeLower middle incomeLuxembourgMacao SAR, ChinaMacedonia, FYRMadagascarMalawiMalaysiaMaldivesMaliMaltaMauritaniaMauritiusMexicoMicronesia, Fed. Sts.Middle East & North AfricaMiddle East & North Africa (excluding high income)Middle East & North Africa (IDA & IBRD countries)Middle incomeMoldovaMongoliaMontenegroMoroccoMozambiqueMyanmarNamibiaNepalNetherlandsNew CaledoniaNew ZealandNicaraguaNigerNigeriaNorth AmericaNorwayOECD membersOmanOther small statesPacific island small statesPakistanPanamaPapua New GuineaParaguayPeruPhilippinesPolandPortugalPost-demographic dividendPre-demographic dividendPuerto RicoQatarRomaniaRussian FederationRwandaSamoaSao Tome and PrincipeSaudi ArabiaSenegalSerbiaSeychellesSierra LeoneSingaporeSlovak RepublicSloveniaSmall statesSolomon IslandsSomaliaSouth AfricaSouth AsiaSouth Asia (IDA & IBRD)South SudanSpainSri LankaSt. LuciaSt. Vincent and the GrenadinesSub-Saharan Africa Sub-Saharan Africa (excluding high income)Sub-Saharan Africa (IDA & IBRD countries)SudanSurinameSwazilandSwedenSwitzerlandSyrian Arab RepublicTajikistanTanzaniaThailandTimor-LesteTogoTongaTrinidad and TobagoTunisiaTurkeyTurkmenistanUgandaUkraineUnited Arab EmiratesUnited KingdomUnited StatesUpper middle incomeUruguayUzbekistanVanuatuVenezuela, RBVietnamVirgin Islands (U.S.)West Bank and GazaWorldYemen, Rep.ZambiaZimbabwe línea de tiempo (timeline):
En esta escala de tiempo se presenta un gráfico de 1961 y 2016 de Singapore. Los datos de 1960 están ausentes. El número de observaciones reales por fecha: 56.
Fuente (nombre):
Indicadores del desarrollo mundial
Fuente (organización):
United Nations Population Division, World Population Prospects.
Categorías:
Health, Gender, Social Development
Se ha actualizado:
23 abr 2017 año
Los indicadores de los cambios de valor en los últimos años
Mínimo:
3.796
1 ene 2016 año
Máximo:
56.998
1 ene 1961 año
A la fecha de observación
Valor
Cambio absoluto
El cambio con respecto al valor anterior
1 ene 1961 año
56.998
+56.998
0.0%
1 ene 1962 año
49.998
-7.0
-12.28%
1 ene 1963 año
42.998
-7.0
-14.0%
1 ene 1964 año
40.799
-2.199
-5.11%
1 ene 1965 año
38.6
-2.199
-5.39%
1 ene 1966 año
36.401
-2.199
-5.7%
1 ene 1967 año
34.202
-2.199
-6.04%
1 ene 1968 año
32.003
-2.199
-6.43%
1 ene 1969 año
30.602
-1.401
-4.38%
1 ene 1970 año
29.201
-1.401
-4.58%
1 ene 1971 año
27.799
-1.401
-4.8%
1 ene 1972 año
26.398
-1.401
-5.04%
1 ene 1973 año
24.997
-1.401
-5.31%
1 ene 1974 año
22.398
-2.599
-10.4%
1 ene 1975 año
19.798
-2.599
-11.61%
1 ene 1976 año
17.199
-2.599
-13.13%
1 ene 1977 año
14.599
-2.599
-15.11%
1 ene 1978 año
12.0
-2.599
-17.8%
1 ene 1979 año
11.802
-0.198
-1.65%
1 ene 1980 año
11.604
-0.198
-1.68%
1 ene 1981 año
11.407
-0.198
-1.7%
1 ene 1982 año
11.209
-0.198
-1.73%
1 ene 1983 año
11.011
-0.198
-1.76%
1 ene 1984 año
10.399
-0.612
-5.56%
1 ene 1985 año
9.787
-0.612
-5.89%
1 ene 1986 año
9.174
-0.612
-6.26%
1 ene 1987 año
8.562
-0.612
-6.67%
1 ene 1988 año
7.95
-0.612
-7.15%
1 ene 1989 año
7.938
-0.012
-0.15%
1 ene 1990 año
7.926
-0.012
-0.15%
1 ene 1991 año
7.913
-0.012
-0.15%
1 ene 1992 año
7.901
-0.012
-0.15%
1 ene 1993 año
7.889
-0.012
-0.15%
1 ene 1994 año
7.799
-0.09
-1.14%
1 ene 1995 año
7.71
-0.09
-1.15%
1 ene 1996 año
7.62
-0.09
-1.16%
1 ene 1997 año
7.531
-0.09
-1.18%
1 ene 1998 año
7.441
-0.09
-1.19%
1 ene 1999 año
7.461
+0.02
0.27%
1 ene 2000 año
7.481
+0.02
0.27%
1 ene 2001 año
7.501
+0.02
0.27%
1 ene 2002 año
7.521
+0.02
0.27%
1 ene 2003 año
7.541
+0.02
0.27%
1 ene 2004 año
7.225
-0.316
-4.19%
1 ene 2005 año
6.909
-0.316
-4.37%
1 ene 2006 año
6.593
-0.316
-4.57%
1 ene 2007 año
6.277
-0.316
-4.79%
1 ene 2008 año
5.961
-0.316
-5.03%
1 ene 2009 año
5.551
-0.41
-6.88%
1 ene 2010 año
5.14
-0.41
-7.39%
1 ene 2011 año
4.73
-0.41
-7.98%
1 ene 2012 año
4.319
-0.41
-8.68%
1 ene 2013 año
3.909
-0.41
-9.5%
1 ene 2014 año
3.871
-0.038
-0.97%
1 ene 2015 año
3.833
-0.038
-0.98%
1 ene 2016 año
3.796
-0.038
-0.99%
Ranking de los países por los datos estadísticos actuales


Comentarios: