29
/es/
es
AIzaSyAYiBZKx7MnpbEhh9jyipgxe19OcubqV5w
April 1, 2024
143710
Guam
GUM
true
2
1
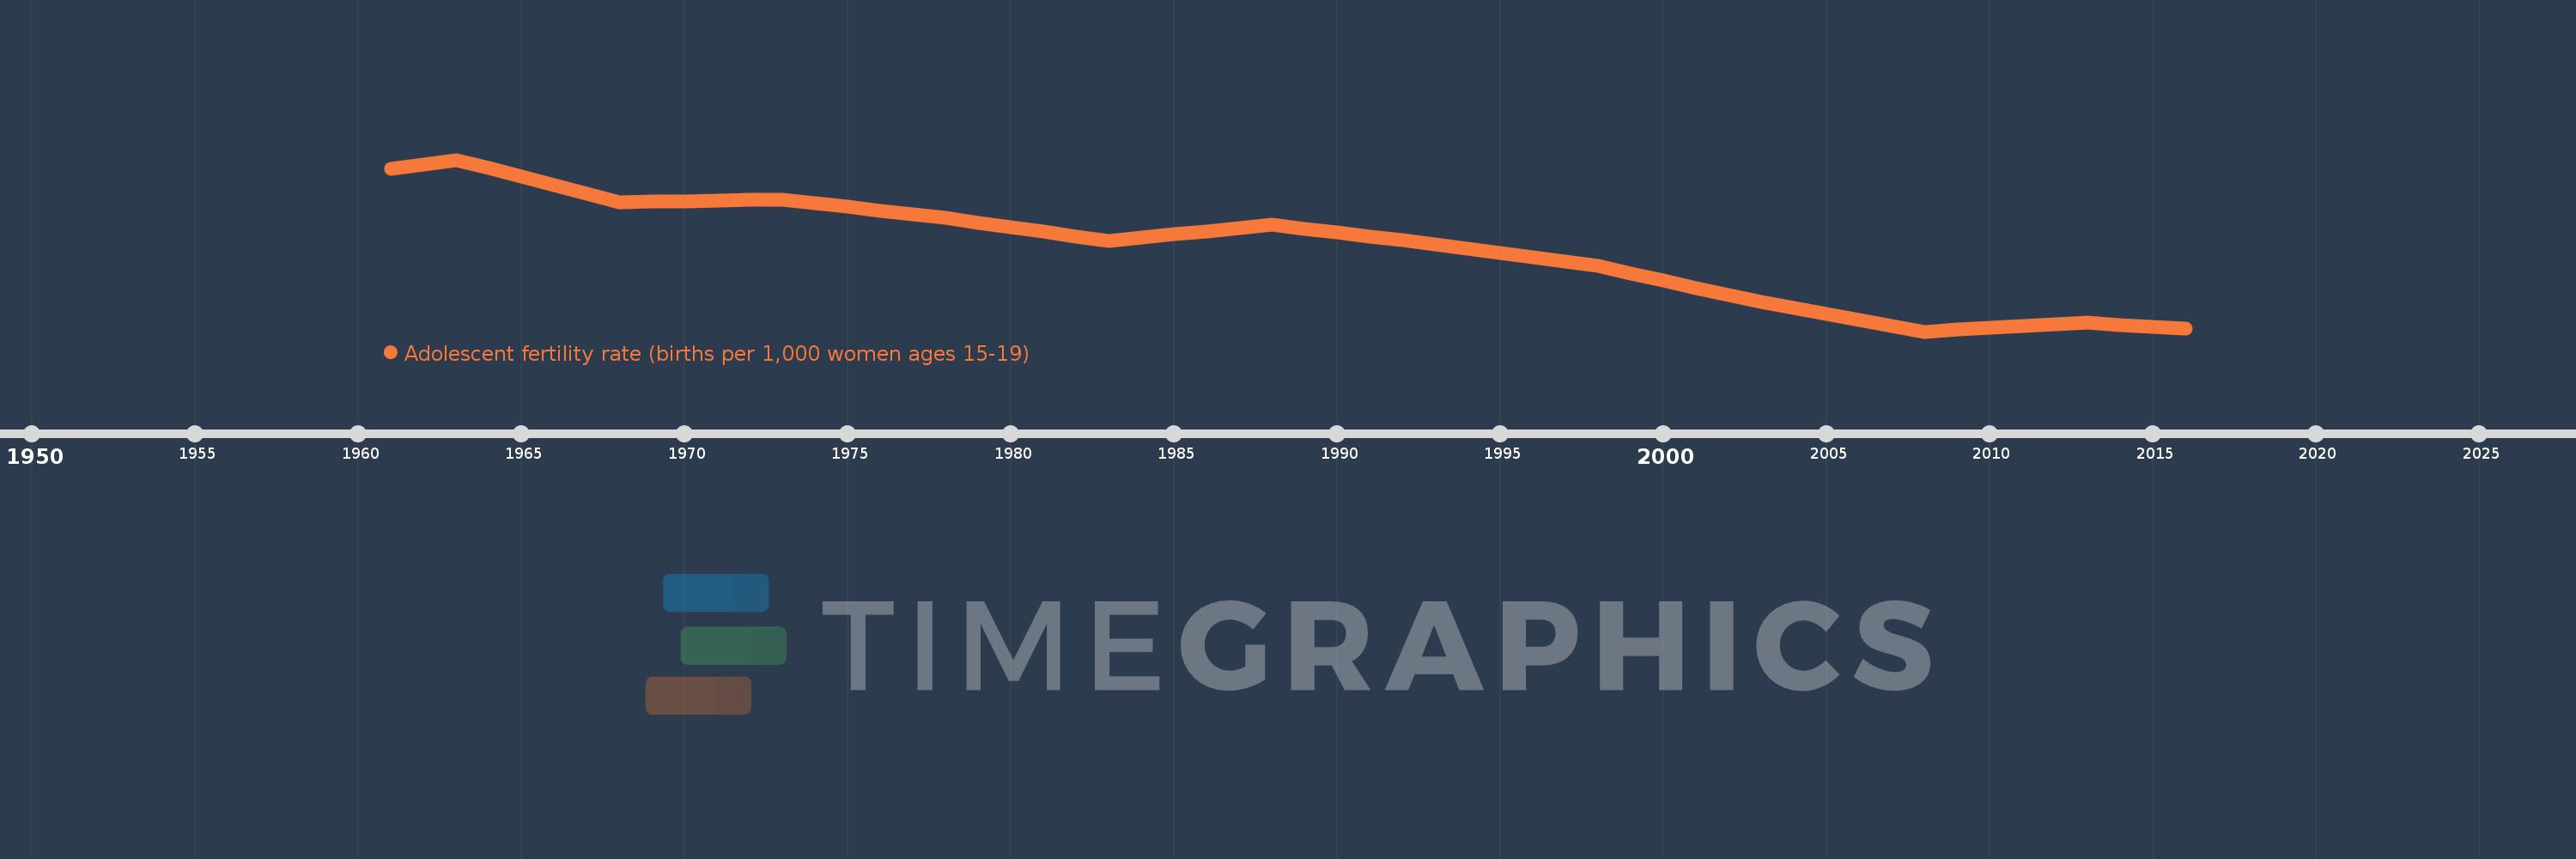
Adolescent fertility rate (births per 1,000 women ages 15-19)
2016,2015,2014,2013,2012,2011,2010,2009,2008,2007,2006,2005,2004,2003,2002,2001,2000,1999,1998,1997,1996,1995,1994,1993,1992,1991,1990,1989,1988,1987,1986,1985,1984,1983,1982,1981,1980,1979,1978,1977,1976,1975,1974,1973,1972,1971,1970,1969,1968,1967,1966,1965,1964,1963,1962,1961
Estas estadísticas en otros países:
AfghanistanAlbaniaAlgeriaAngolaAntigua and BarbudaArab WorldArgentinaArmeniaArubaAustraliaAustriaAzerbaijanBahamas, TheBahrainBangladeshBarbadosBelarusBelgiumBelizeBeninBhutanBoliviaBosnia and HerzegovinaBotswanaBrazilBrunei DarussalamBulgariaBurkina FasoBurundiCabo VerdeCambodiaCameroonCanadaCaribbean small statesCentral African RepublicCentral Europe and the BalticsChadChannel IslandsChileChinaColombiaComorosCongo, Dem. Rep.Congo, Rep.Costa RicaCote d'IvoireCroatiaCubaCuracaoCyprusCzech RepublicDenmarkDjiboutiDominican RepublicEarly-demographic dividendEast Asia & PacificEast Asia & Pacific (excluding high income)East Asia & Pacific (IDA & IBRD countries)EcuadorEgypt, Arab Rep.El SalvadorEquatorial GuineaEritreaEstoniaEthiopiaEuro areaEurope & Central AsiaEurope & Central Asia (excluding high income)Europe & Central Asia (IDA & IBRD countries)European UnionFijiFinlandFragile and conflict affected situationsFranceFrench PolynesiaGabonGambia, TheGeorgiaGermanyGhanaGreeceGrenadaGuamGuatemalaGuineaGuinea-BissauGuyanaHaitiHeavily indebted poor countries (HIPC)High incomeHondurasHong Kong SAR, ChinaHungaryIBRD onlyIcelandIDA & IBRD totalIDA blendIDA onlyIDA totalIndiaIndonesiaIran, Islamic Rep.IraqIrelandIsraelItalyJamaicaJapanJordanKazakhstanKenyaKiribatiKorea, Dem. People’s Rep.Korea, Rep.KuwaitKyrgyz RepublicLao PDRLate-demographic dividendLatin America & Caribbean Latin America & Caribbean (excluding high income)Latin America & the Caribbean (IDA & IBRD countries)LatviaLeast developed countries: UN classificationLebanonLesothoLiberiaLibyaLithuaniaLow & middle incomeLow incomeLower middle incomeLuxembourgMacao SAR, ChinaMacedonia, FYRMadagascarMalawiMalaysiaMaldivesMaliMaltaMauritaniaMauritiusMexicoMicronesia, Fed. Sts.Middle East & North AfricaMiddle East & North Africa (excluding high income)Middle East & North Africa (IDA & IBRD countries)Middle incomeMoldovaMongoliaMontenegroMoroccoMozambiqueMyanmarNamibiaNepalNetherlandsNew CaledoniaNew ZealandNicaraguaNigerNigeriaNorth AmericaNorwayOECD membersOmanOther small statesPacific island small statesPakistanPanamaPapua New GuineaParaguayPeruPhilippinesPolandPortugalPost-demographic dividendPre-demographic dividendPuerto RicoQatarRomaniaRussian FederationRwandaSamoaSao Tome and PrincipeSaudi ArabiaSenegalSerbiaSeychellesSierra LeoneSingaporeSlovak RepublicSloveniaSmall statesSolomon IslandsSomaliaSouth AfricaSouth AsiaSouth Asia (IDA & IBRD)South SudanSpainSri LankaSt. LuciaSt. Vincent and the GrenadinesSub-Saharan Africa Sub-Saharan Africa (excluding high income)Sub-Saharan Africa (IDA & IBRD countries)SudanSurinameSwazilandSwedenSwitzerlandSyrian Arab RepublicTajikistanTanzaniaThailandTimor-LesteTogoTongaTrinidad and TobagoTunisiaTurkeyTurkmenistanUgandaUkraineUnited Arab EmiratesUnited KingdomUnited StatesUpper middle incomeUruguayUzbekistanVanuatuVenezuela, RBVietnamVirgin Islands (U.S.)West Bank and GazaWorldYemen, Rep.ZambiaZimbabwe línea de tiempo (timeline):
En esta escala de tiempo se presenta un gráfico de 1961 y 2016 de Guam. Los datos de 1960 están ausentes. El número de observaciones reales por fecha: 56.
Fuente (nombre):
Indicadores del desarrollo mundial
Fuente (organización):
United Nations Population Division, World Population Prospects.
Categorías:
Health, Gender, Social Development
Se ha actualizado:
23 abr 2017 año
Los indicadores de los cambios de valor en los últimos años
Mínimo:
47.14
1 ene 2008 año
Máximo:
106.778
1 ene 1963 año
A la fecha de observación
Valor
Cambio absoluto
El cambio con respecto al valor anterior
1 ene 1961 año
103.706
+103.706
0.0%
1 ene 1962 año
105.242
+1.536
1.48%
1 ene 1963 año
106.778
+1.536
1.46%
1 ene 1964 año
103.833
-2.945
-2.76%
1 ene 1965 año
100.888
-2.945
-2.84%
1 ene 1966 año
97.943
-2.945
-2.92%
1 ene 1967 año
94.998
-2.945
-3.01%
1 ene 1968 año
92.053
-2.945
-3.1%
1 ene 1969 año
92.253
+0.2
0.22%
1 ene 1970 año
92.453
+0.2
0.22%
1 ene 1971 año
92.654
+0.2
0.22%
1 ene 1972 año
92.854
+0.2
0.22%
1 ene 1973 año
93.054
+0.2
0.22%
1 ene 1974 año
91.752
-1.302
-1.4%
1 ene 1975 año
90.45
-1.302
-1.42%
1 ene 1976 año
89.147
-1.302
-1.44%
1 ene 1977 año
87.845
-1.302
-1.46%
1 ene 1978 año
86.543
-1.302
-1.48%
1 ene 1979 año
84.952
-1.591
-1.84%
1 ene 1980 año
83.361
-1.591
-1.87%
1 ene 1981 año
81.77
-1.591
-1.91%
1 ene 1982 año
80.179
-1.591
-1.95%
1 ene 1983 año
78.588
-1.591
-1.98%
1 ene 1984 año
79.724
+1.136
1.45%
1 ene 1985 año
80.861
+1.136
1.43%
1 ene 1986 año
81.997
+1.136
1.41%
1 ene 1987 año
83.134
+1.136
1.39%
1 ene 1988 año
84.27
+1.136
1.37%
1 ene 1989 año
82.921
-1.349
-1.6%
1 ene 1990 año
81.572
-1.349
-1.63%
1 ene 1991 año
80.222
-1.349
-1.65%
1 ene 1992 año
78.873
-1.349
-1.68%
1 ene 1993 año
77.524
-1.349
-1.71%
1 ene 1994 año
75.994
-1.53
-1.97%
1 ene 1995 año
74.464
-1.53
-2.01%
1 ene 1996 año
72.935
-1.53
-2.05%
1 ene 1997 año
71.405
-1.53
-2.1%
1 ene 1998 año
69.875
-1.53
-2.14%
1 ene 1999 año
67.364
-2.511
-3.59%
1 ene 2000 año
64.853
-2.511
-3.73%
1 ene 2001 año
62.343
-2.511
-3.87%
1 ene 2002 año
59.832
-2.511
-4.03%
1 ene 2003 año
57.321
-2.511
-4.2%
1 ene 2004 año
55.285
-2.036
-3.55%
1 ene 2005 año
53.249
-2.036
-3.68%
1 ene 2006 año
51.212
-2.036
-3.82%
1 ene 2007 año
49.176
-2.036
-3.98%
1 ene 2008 año
47.14
-2.036
-4.14%
1 ene 2009 año
47.737
+0.597
1.27%
1 ene 2010 año
48.334
+0.597
1.25%
1 ene 2011 año
48.932
+0.597
1.24%
1 ene 2012 año
49.529
+0.597
1.22%
1 ene 2013 año
50.126
+0.597
1.21%
1 ene 2014 año
49.458
-0.668
-1.33%
1 ene 2015 año
48.789
-0.668
-1.35%
1 ene 2016 año
48.121
-0.668
-1.37%
Ranking de los países por los datos estadísticos actuales


Comentarios: