29
/es/
es
AIzaSyAYiBZKx7MnpbEhh9jyipgxe19OcubqV5w
April 1, 2024
233350
Sao Tome and Principe
STP
true
2
1
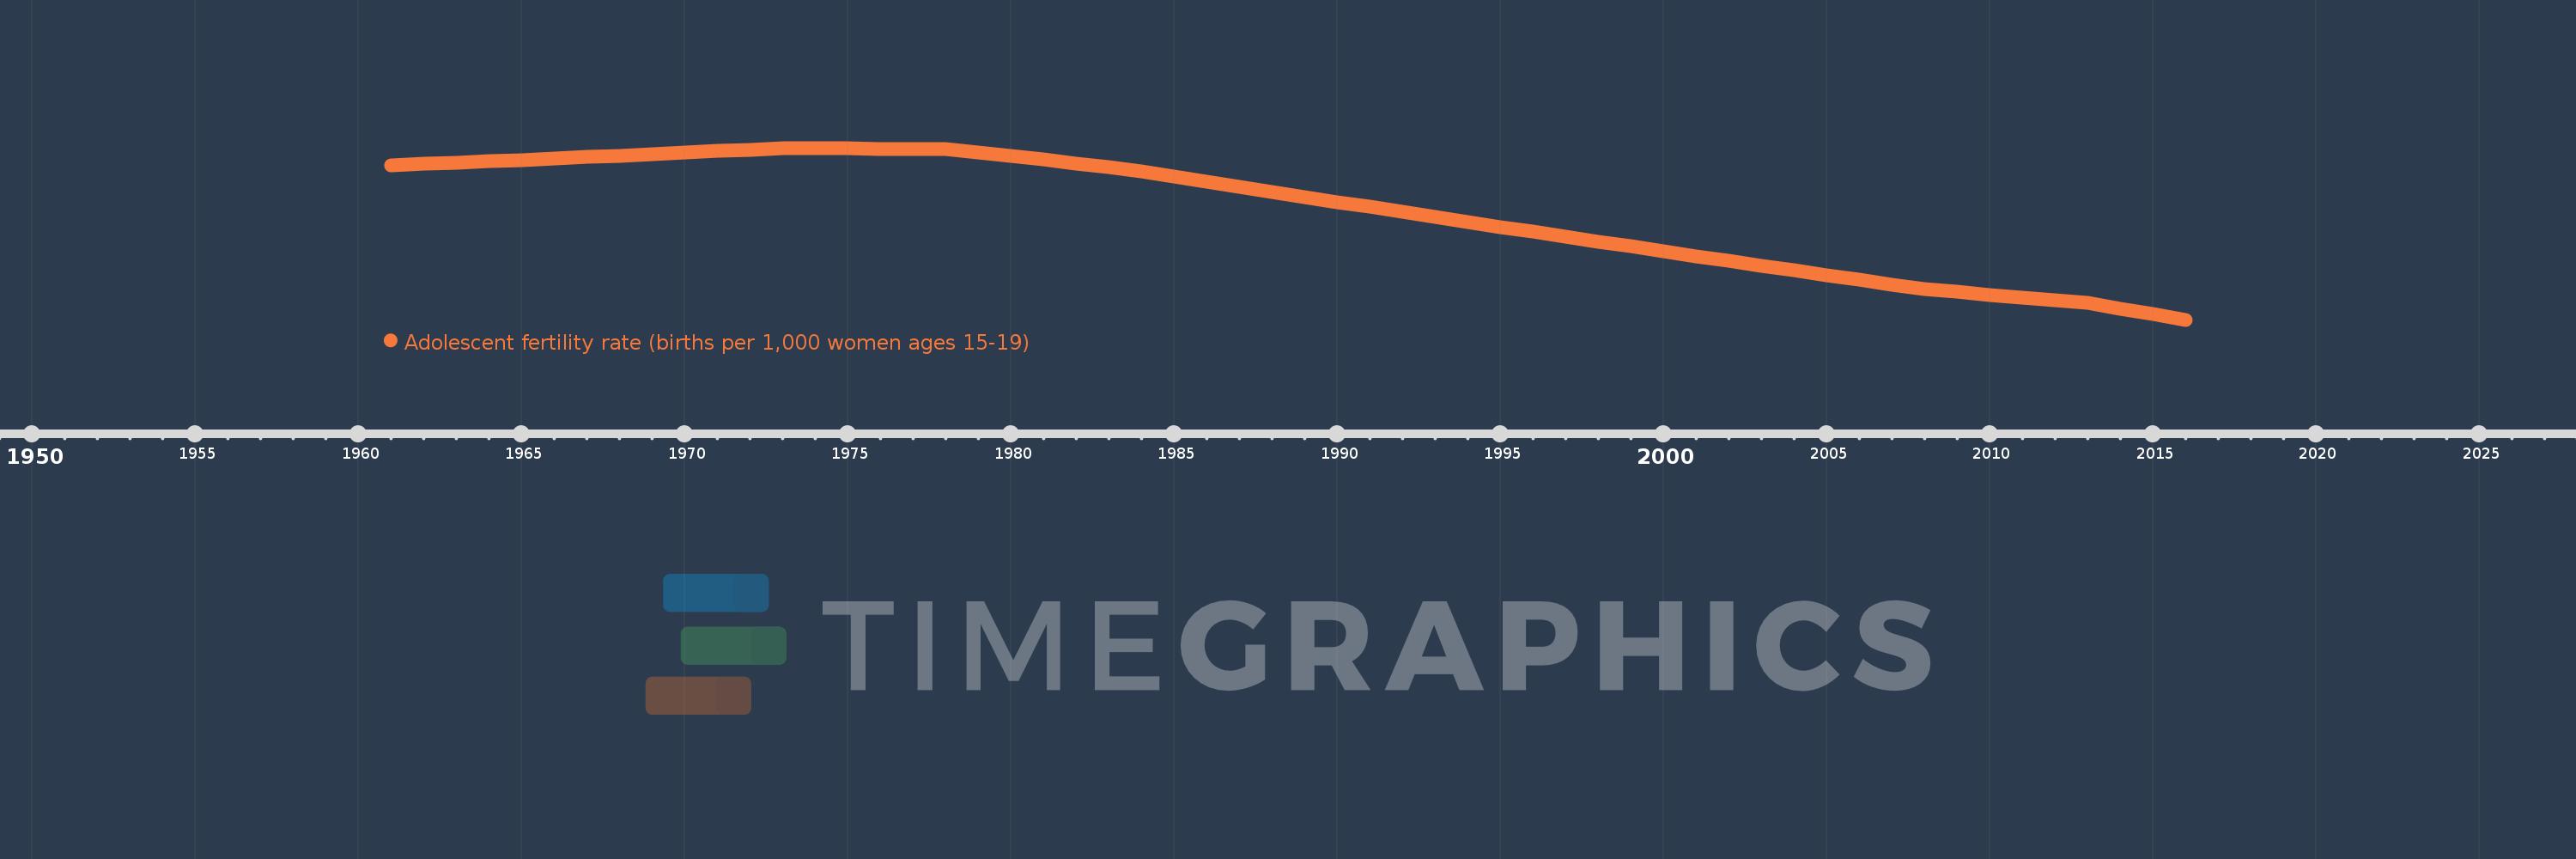
Adolescent fertility rate (births per 1,000 women ages 15-19)
2016,2015,2014,2013,2012,2011,2010,2009,2008,2007,2006,2005,2004,2003,2002,2001,2000,1999,1998,1997,1996,1995,1994,1993,1992,1991,1990,1989,1988,1987,1986,1985,1984,1983,1982,1981,1980,1979,1978,1977,1976,1975,1974,1973,1972,1971,1970,1969,1968,1967,1966,1965,1964,1963,1962,1961
Estas estadísticas en otros países:
AfghanistanAlbaniaAlgeriaAngolaAntigua and BarbudaArab WorldArgentinaArmeniaArubaAustraliaAustriaAzerbaijanBahamas, TheBahrainBangladeshBarbadosBelarusBelgiumBelizeBeninBhutanBoliviaBosnia and HerzegovinaBotswanaBrazilBrunei DarussalamBulgariaBurkina FasoBurundiCabo VerdeCambodiaCameroonCanadaCaribbean small statesCentral African RepublicCentral Europe and the BalticsChadChannel IslandsChileChinaColombiaComorosCongo, Dem. Rep.Congo, Rep.Costa RicaCote d'IvoireCroatiaCubaCuracaoCyprusCzech RepublicDenmarkDjiboutiDominican RepublicEarly-demographic dividendEast Asia & PacificEast Asia & Pacific (excluding high income)East Asia & Pacific (IDA & IBRD countries)EcuadorEgypt, Arab Rep.El SalvadorEquatorial GuineaEritreaEstoniaEthiopiaEuro areaEurope & Central AsiaEurope & Central Asia (excluding high income)Europe & Central Asia (IDA & IBRD countries)European UnionFijiFinlandFragile and conflict affected situationsFranceFrench PolynesiaGabonGambia, TheGeorgiaGermanyGhanaGreeceGrenadaGuamGuatemalaGuineaGuinea-BissauGuyanaHaitiHeavily indebted poor countries (HIPC)High incomeHondurasHong Kong SAR, ChinaHungaryIBRD onlyIcelandIDA & IBRD totalIDA blendIDA onlyIDA totalIndiaIndonesiaIran, Islamic Rep.IraqIrelandIsraelItalyJamaicaJapanJordanKazakhstanKenyaKiribatiKorea, Dem. People’s Rep.Korea, Rep.KuwaitKyrgyz RepublicLao PDRLate-demographic dividendLatin America & Caribbean Latin America & Caribbean (excluding high income)Latin America & the Caribbean (IDA & IBRD countries)LatviaLeast developed countries: UN classificationLebanonLesothoLiberiaLibyaLithuaniaLow & middle incomeLow incomeLower middle incomeLuxembourgMacao SAR, ChinaMacedonia, FYRMadagascarMalawiMalaysiaMaldivesMaliMaltaMauritaniaMauritiusMexicoMicronesia, Fed. Sts.Middle East & North AfricaMiddle East & North Africa (excluding high income)Middle East & North Africa (IDA & IBRD countries)Middle incomeMoldovaMongoliaMontenegroMoroccoMozambiqueMyanmarNamibiaNepalNetherlandsNew CaledoniaNew ZealandNicaraguaNigerNigeriaNorth AmericaNorwayOECD membersOmanOther small statesPacific island small statesPakistanPanamaPapua New GuineaParaguayPeruPhilippinesPolandPortugalPost-demographic dividendPre-demographic dividendPuerto RicoQatarRomaniaRussian FederationRwandaSamoaSao Tome and PrincipeSaudi ArabiaSenegalSerbiaSeychellesSierra LeoneSingaporeSlovak RepublicSloveniaSmall statesSolomon IslandsSomaliaSouth AfricaSouth AsiaSouth Asia (IDA & IBRD)South SudanSpainSri LankaSt. LuciaSt. Vincent and the GrenadinesSub-Saharan Africa Sub-Saharan Africa (excluding high income)Sub-Saharan Africa (IDA & IBRD countries)SudanSurinameSwazilandSwedenSwitzerlandSyrian Arab RepublicTajikistanTanzaniaThailandTimor-LesteTogoTongaTrinidad and TobagoTunisiaTurkeyTurkmenistanUgandaUkraineUnited Arab EmiratesUnited KingdomUnited StatesUpper middle incomeUruguayUzbekistanVanuatuVenezuela, RBVietnamVirgin Islands (U.S.)West Bank and GazaWorldYemen, Rep.ZambiaZimbabwe línea de tiempo (timeline):
En esta escala de tiempo se presenta un gráfico de 1961 y 2016 de Sao Tome and Principe. Los datos de 1960 están ausentes. El número de observaciones reales por fecha: 56.
Fuente (nombre):
Indicadores del desarrollo mundial
Fuente (organización):
United Nations Population Division, World Population Prospects.
Categorías:
Health, Gender, Social Development
Se ha actualizado:
23 abr 2017 año
Los indicadores de los cambios de valor en los últimos años
Mínimo:
83.456
1 ene 2016 año
Máximo:
136.826
1 ene 1973 año
A la fecha de observación
Valor
Cambio absoluto
El cambio con respecto al valor anterior
1 ene 1961 año
131.46
+131.46
0.0%
1 ene 1962 año
131.88
+0.42
0.32%
1 ene 1963 año
132.3
+0.42
0.32%
1 ene 1964 año
132.72
+0.42
0.32%
1 ene 1965 año
133.14
+0.42
0.32%
1 ene 1966 año
133.56
+0.42
0.32%
1 ene 1967 año
133.98
+0.42
0.31%
1 ene 1968 año
134.4
+0.42
0.31%
1 ene 1969 año
134.885
+0.485
0.36%
1 ene 1970 año
135.37
+0.485
0.36%
1 ene 1971 año
135.856
+0.485
0.36%
1 ene 1972 año
136.341
+0.485
0.36%
1 ene 1973 año
136.826
+0.485
0.36%
1 ene 1974 año
136.74
-0.086
-0.06%
1 ene 1975 año
136.654
-0.086
-0.06%
1 ene 1976 año
136.567
-0.086
-0.06%
1 ene 1977 año
136.481
-0.086
-0.06%
1 ene 1978 año
136.395
-0.086
-0.06%
1 ene 1979 año
135.312
-1.083
-0.79%
1 ene 1980 año
134.229
-1.083
-0.8%
1 ene 1981 año
133.147
-1.083
-0.81%
1 ene 1982 año
132.064
-1.083
-0.81%
1 ene 1983 año
130.981
-1.083
-0.82%
1 ene 1984 año
129.419
-1.562
-1.19%
1 ene 1985 año
127.856
-1.562
-1.21%
1 ene 1986 año
126.294
-1.562
-1.22%
1 ene 1987 año
124.731
-1.562
-1.24%
1 ene 1988 año
123.169
-1.562
-1.25%
1 ene 1989 año
121.612
-1.557
-1.26%
1 ene 1990 año
120.055
-1.557
-1.28%
1 ene 1991 año
118.499
-1.557
-1.3%
1 ene 1992 año
116.942
-1.557
-1.31%
1 ene 1993 año
115.385
-1.557
-1.33%
1 ene 1994 año
113.851
-1.534
-1.33%
1 ene 1995 año
112.316
-1.534
-1.35%
1 ene 1996 año
110.782
-1.534
-1.37%
1 ene 1997 año
109.247
-1.534
-1.39%
1 ene 1998 año
107.713
-1.534
-1.4%
1 ene 1999 año
106.217
-1.496
-1.39%
1 ene 2000 año
104.721
-1.496
-1.41%
1 ene 2001 año
103.224
-1.496
-1.43%
1 ene 2002 año
101.728
-1.496
-1.45%
1 ene 2003 año
100.232
-1.496
-1.47%
1 ene 2004 año
98.786
-1.446
-1.44%
1 ene 2005 año
97.34
-1.446
-1.46%
1 ene 2006 año
95.893
-1.446
-1.49%
1 ene 2007 año
94.447
-1.446
-1.51%
1 ene 2008 año
93.001
-1.446
-1.53%
1 ene 2009 año
92.119
-0.882
-0.95%
1 ene 2010 año
91.237
-0.882
-0.96%
1 ene 2011 año
90.356
-0.882
-0.97%
1 ene 2012 año
89.474
-0.882
-0.98%
1 ene 2013 año
88.592
-0.882
-0.99%
1 ene 2014 año
86.88
-1.712
-1.93%
1 ene 2015 año
85.168
-1.712
-1.97%
1 ene 2016 año
83.456
-1.712
-2.01%
Ranking de los países por los datos estadísticos actuales


Comentarios: