29
/es/
es
AIzaSyAYiBZKx7MnpbEhh9jyipgxe19OcubqV5w
April 1, 2024
24651
Caribbean small states
CSS
false
2
1
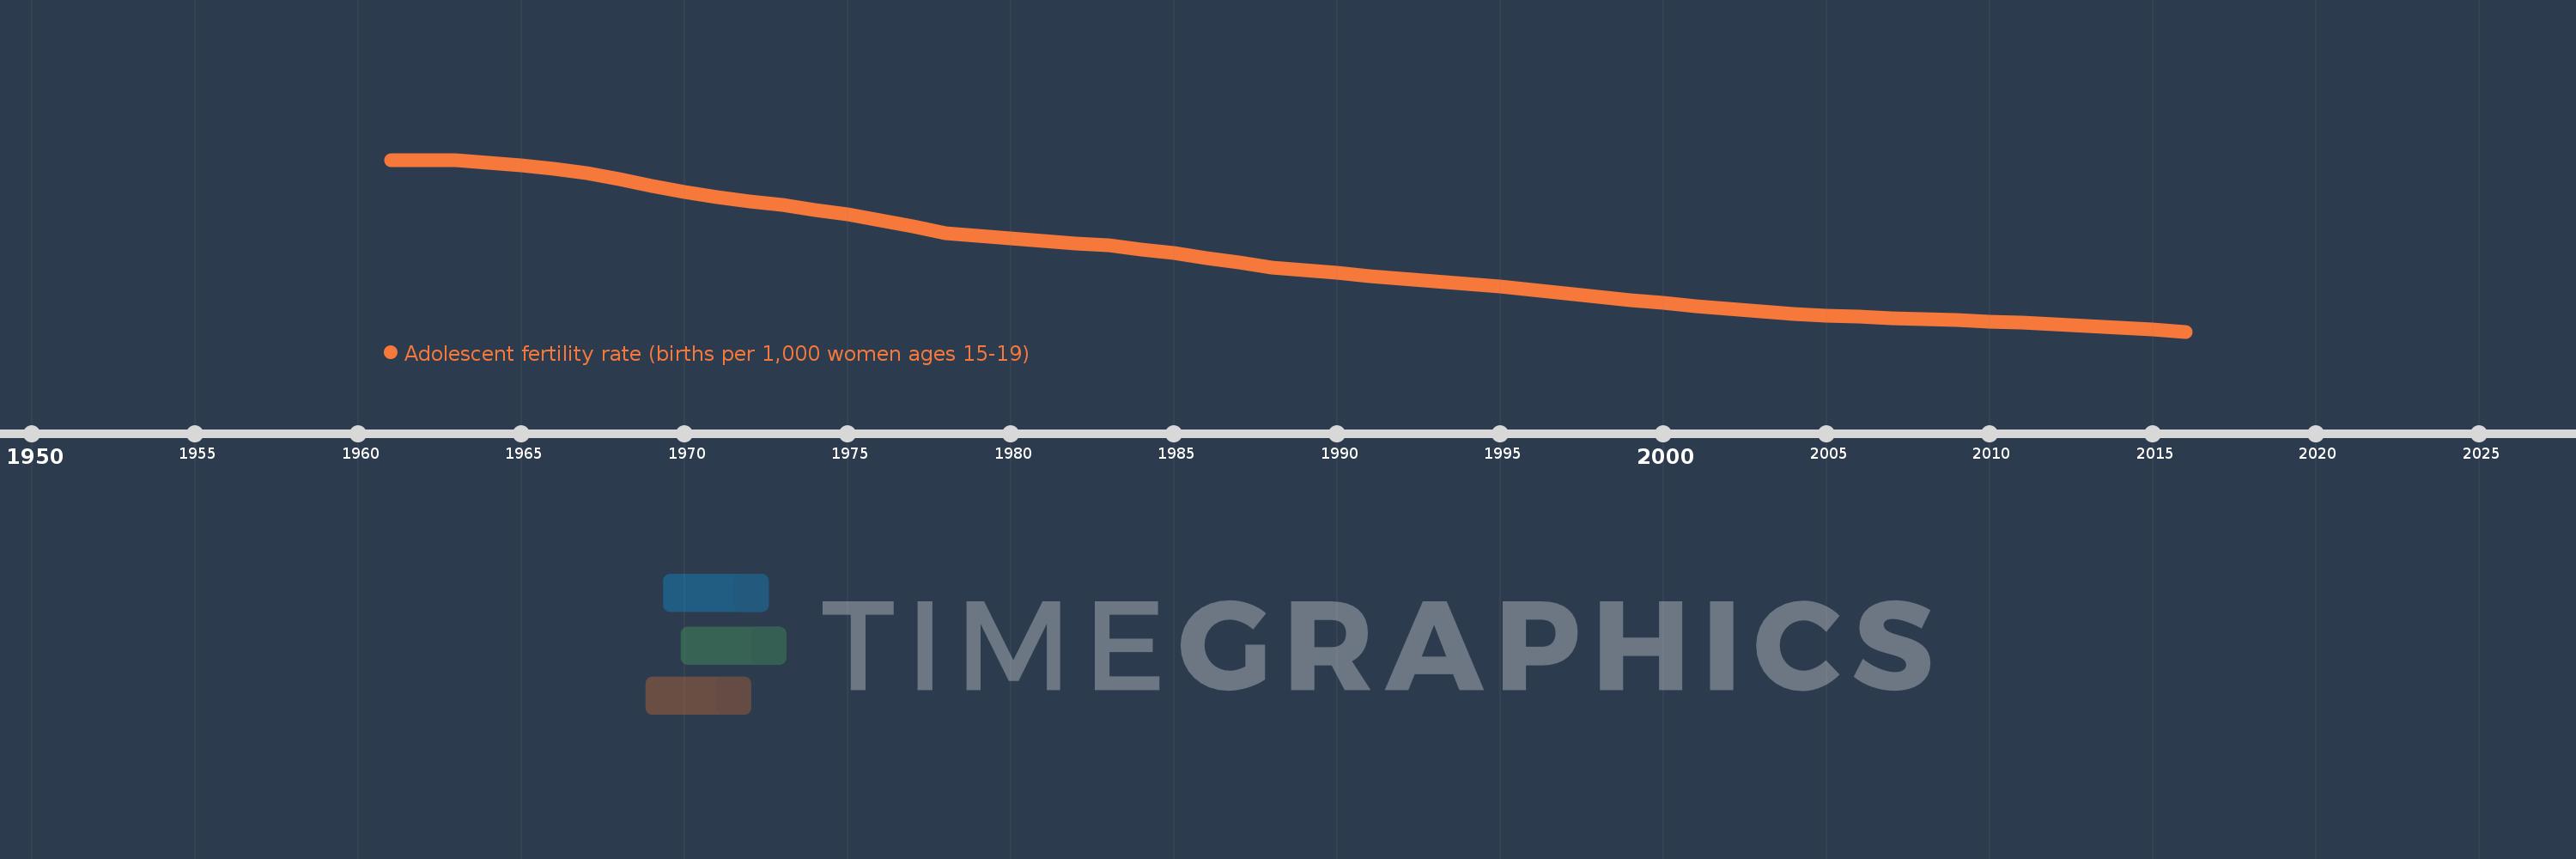
Adolescent fertility rate (births per 1,000 women ages 15-19)
2016,2015,2014,2013,2012,2011,2010,2009,2008,2007,2006,2005,2004,2003,2002,2001,2000,1999,1998,1997,1996,1995,1994,1993,1992,1991,1990,1989,1988,1987,1986,1985,1984,1983,1982,1981,1980,1979,1978,1977,1976,1975,1974,1973,1972,1971,1970,1969,1968,1967,1966,1965,1964,1963,1962,1961
Estas estadísticas en otros países:
AfghanistanAlbaniaAlgeriaAngolaAntigua and BarbudaArab WorldArgentinaArmeniaArubaAustraliaAustriaAzerbaijanBahamas, TheBahrainBangladeshBarbadosBelarusBelgiumBelizeBeninBhutanBoliviaBosnia and HerzegovinaBotswanaBrazilBrunei DarussalamBulgariaBurkina FasoBurundiCabo VerdeCambodiaCameroonCanadaCaribbean small statesCentral African RepublicCentral Europe and the BalticsChadChannel IslandsChileChinaColombiaComorosCongo, Dem. Rep.Congo, Rep.Costa RicaCote d'IvoireCroatiaCubaCuracaoCyprusCzech RepublicDenmarkDjiboutiDominican RepublicEarly-demographic dividendEast Asia & PacificEast Asia & Pacific (excluding high income)East Asia & Pacific (IDA & IBRD countries)EcuadorEgypt, Arab Rep.El SalvadorEquatorial GuineaEritreaEstoniaEthiopiaEuro areaEurope & Central AsiaEurope & Central Asia (excluding high income)Europe & Central Asia (IDA & IBRD countries)European UnionFijiFinlandFragile and conflict affected situationsFranceFrench PolynesiaGabonGambia, TheGeorgiaGermanyGhanaGreeceGrenadaGuamGuatemalaGuineaGuinea-BissauGuyanaHaitiHeavily indebted poor countries (HIPC)High incomeHondurasHong Kong SAR, ChinaHungaryIBRD onlyIcelandIDA & IBRD totalIDA blendIDA onlyIDA totalIndiaIndonesiaIran, Islamic Rep.IraqIrelandIsraelItalyJamaicaJapanJordanKazakhstanKenyaKiribatiKorea, Dem. People’s Rep.Korea, Rep.KuwaitKyrgyz RepublicLao PDRLate-demographic dividendLatin America & Caribbean Latin America & Caribbean (excluding high income)Latin America & the Caribbean (IDA & IBRD countries)LatviaLeast developed countries: UN classificationLebanonLesothoLiberiaLibyaLithuaniaLow & middle incomeLow incomeLower middle incomeLuxembourgMacao SAR, ChinaMacedonia, FYRMadagascarMalawiMalaysiaMaldivesMaliMaltaMauritaniaMauritiusMexicoMicronesia, Fed. Sts.Middle East & North AfricaMiddle East & North Africa (excluding high income)Middle East & North Africa (IDA & IBRD countries)Middle incomeMoldovaMongoliaMontenegroMoroccoMozambiqueMyanmarNamibiaNepalNetherlandsNew CaledoniaNew ZealandNicaraguaNigerNigeriaNorth AmericaNorwayOECD membersOmanOther small statesPacific island small statesPakistanPanamaPapua New GuineaParaguayPeruPhilippinesPolandPortugalPost-demographic dividendPre-demographic dividendPuerto RicoQatarRomaniaRussian FederationRwandaSamoaSao Tome and PrincipeSaudi ArabiaSenegalSerbiaSeychellesSierra LeoneSingaporeSlovak RepublicSloveniaSmall statesSolomon IslandsSomaliaSouth AfricaSouth AsiaSouth Asia (IDA & IBRD)South SudanSpainSri LankaSt. LuciaSt. Vincent and the GrenadinesSub-Saharan Africa Sub-Saharan Africa (excluding high income)Sub-Saharan Africa (IDA & IBRD countries)SudanSurinameSwazilandSwedenSwitzerlandSyrian Arab RepublicTajikistanTanzaniaThailandTimor-LesteTogoTongaTrinidad and TobagoTunisiaTurkeyTurkmenistanUgandaUkraineUnited Arab EmiratesUnited KingdomUnited StatesUpper middle incomeUruguayUzbekistanVanuatuVenezuela, RBVietnamVirgin Islands (U.S.)West Bank and GazaWorldYemen, Rep.ZambiaZimbabwe línea de tiempo (timeline):
En esta escala de tiempo se presenta un gráfico de 1961 y 2016 de Caribbean small states. Los datos de 1960 están ausentes. El número de observaciones reales por fecha: 56.
Fuente (nombre):
Indicadores del desarrollo mundial
Fuente (organización):
United Nations Population Division, World Population Prospects.
Categorías:
Health, Gender, Social Development
Se ha actualizado:
23 abr 2017 año
Los indicadores de los cambios de valor en los últimos años
Mínimo:
55.8
1 ene 2016 año
Máximo:
163.206
1 ene 1963 año
A la fecha de observación
Valor
Cambio absoluto
El cambio con respecto al valor anterior
1 ene 1961 año
162.871
+162.871
0.0%
1 ene 1962 año
162.928
+0.057
0.04%
1 ene 1963 año
163.206
+0.278
0.17%
1 ene 1964 año
161.234
-1.971
-1.21%
1 ene 1965 año
159.516
-1.718
-1.07%
1 ene 1966 año
157.799
-1.717
-1.08%
1 ene 1967 año
154.72
-3.08
-1.95%
1 ene 1968 año
151.313
-3.406
-2.2%
1 ene 1969 año
147.022
-4.291
-2.84%
1 ene 1970 año
143.238
-3.784
-2.57%
1 ene 1971 año
140.07
-3.169
-2.21%
1 ene 1972 año
137.367
-2.703
-1.93%
1 ene 1973 año
135.056
-2.311
-1.68%
1 ene 1974 año
132.04
-3.016
-2.23%
1 ene 1975 año
128.89
-3.15
-2.39%
1 ene 1976 año
125.489
-3.401
-2.64%
1 ene 1977 año
121.598
-3.891
-3.1%
1 ene 1978 año
117.497
-4.101
-3.37%
1 ene 1979 año
115.689
-1.808
-1.54%
1 ene 1980 año
113.953
-1.736
-1.5%
1 ene 1981 año
112.362
-1.591
-1.4%
1 ene 1982 año
111.056
-1.306
-1.16%
1 ene 1983 año
109.863
-1.193
-1.07%
1 ene 1984 año
107.311
-2.552
-2.32%
1 ene 1985 año
104.699
-2.612
-2.43%
1 ene 1986 año
101.925
-2.774
-2.65%
1 ene 1987 año
98.89
-3.035
-2.98%
1 ene 1988 año
95.688
-3.202
-3.24%
1 ene 1989 año
94.012
-1.676
-1.75%
1 ene 1990 año
92.343
-1.669
-1.78%
1 ene 1991 año
90.665
-1.679
-1.82%
1 ene 1992 año
89.049
-1.616
-1.78%
1 ene 1993 año
87.473
-1.575
-1.77%
1 ene 1994 año
85.636
-1.838
-2.1%
1 ene 1995 año
83.757
-1.878
-2.19%
1 ene 1996 año
81.808
-1.949
-2.33%
1 ene 1997 año
79.724
-2.084
-2.55%
1 ene 1998 año
77.518
-2.207
-2.77%
1 ene 1999 año
75.547
-1.971
-2.54%
1 ene 2000 año
73.555
-1.992
-2.64%
1 ene 2001 año
71.619
-1.936
-2.63%
1 ene 2002 año
69.87
-1.749
-2.44%
1 ene 2003 año
68.181
-1.689
-2.42%
1 ene 2004 año
67.04
-1.141
-1.67%
1 ene 2005 año
65.992
-1.049
-1.56%
1 ene 2006 año
65.07
-0.922
-1.4%
1 ene 2007 año
64.304
-0.766
-1.18%
1 ene 2008 año
63.617
-0.687
-1.07%
1 ene 2009 año
62.92
-0.697
-1.1%
1 ene 2010 año
62.152
-0.768
-1.22%
1 ene 2011 año
61.287
-0.865
-1.39%
1 ene 2012 año
60.463
-0.823
-1.34%
1 ene 2013 año
59.559
-0.904
-1.5%
1 ene 2014 año
58.363
-1.196
-2.01%
1 ene 2015 año
57.109
-1.254
-2.15%
1 ene 2016 año
55.8
-1.31
-2.29%
Ranking de los países por los datos estadísticos actuales


Comentarios: