29
/es/
es
AIzaSyAYiBZKx7MnpbEhh9jyipgxe19OcubqV5w
April 1, 2024
264193
Togo
TGO
true
2
1
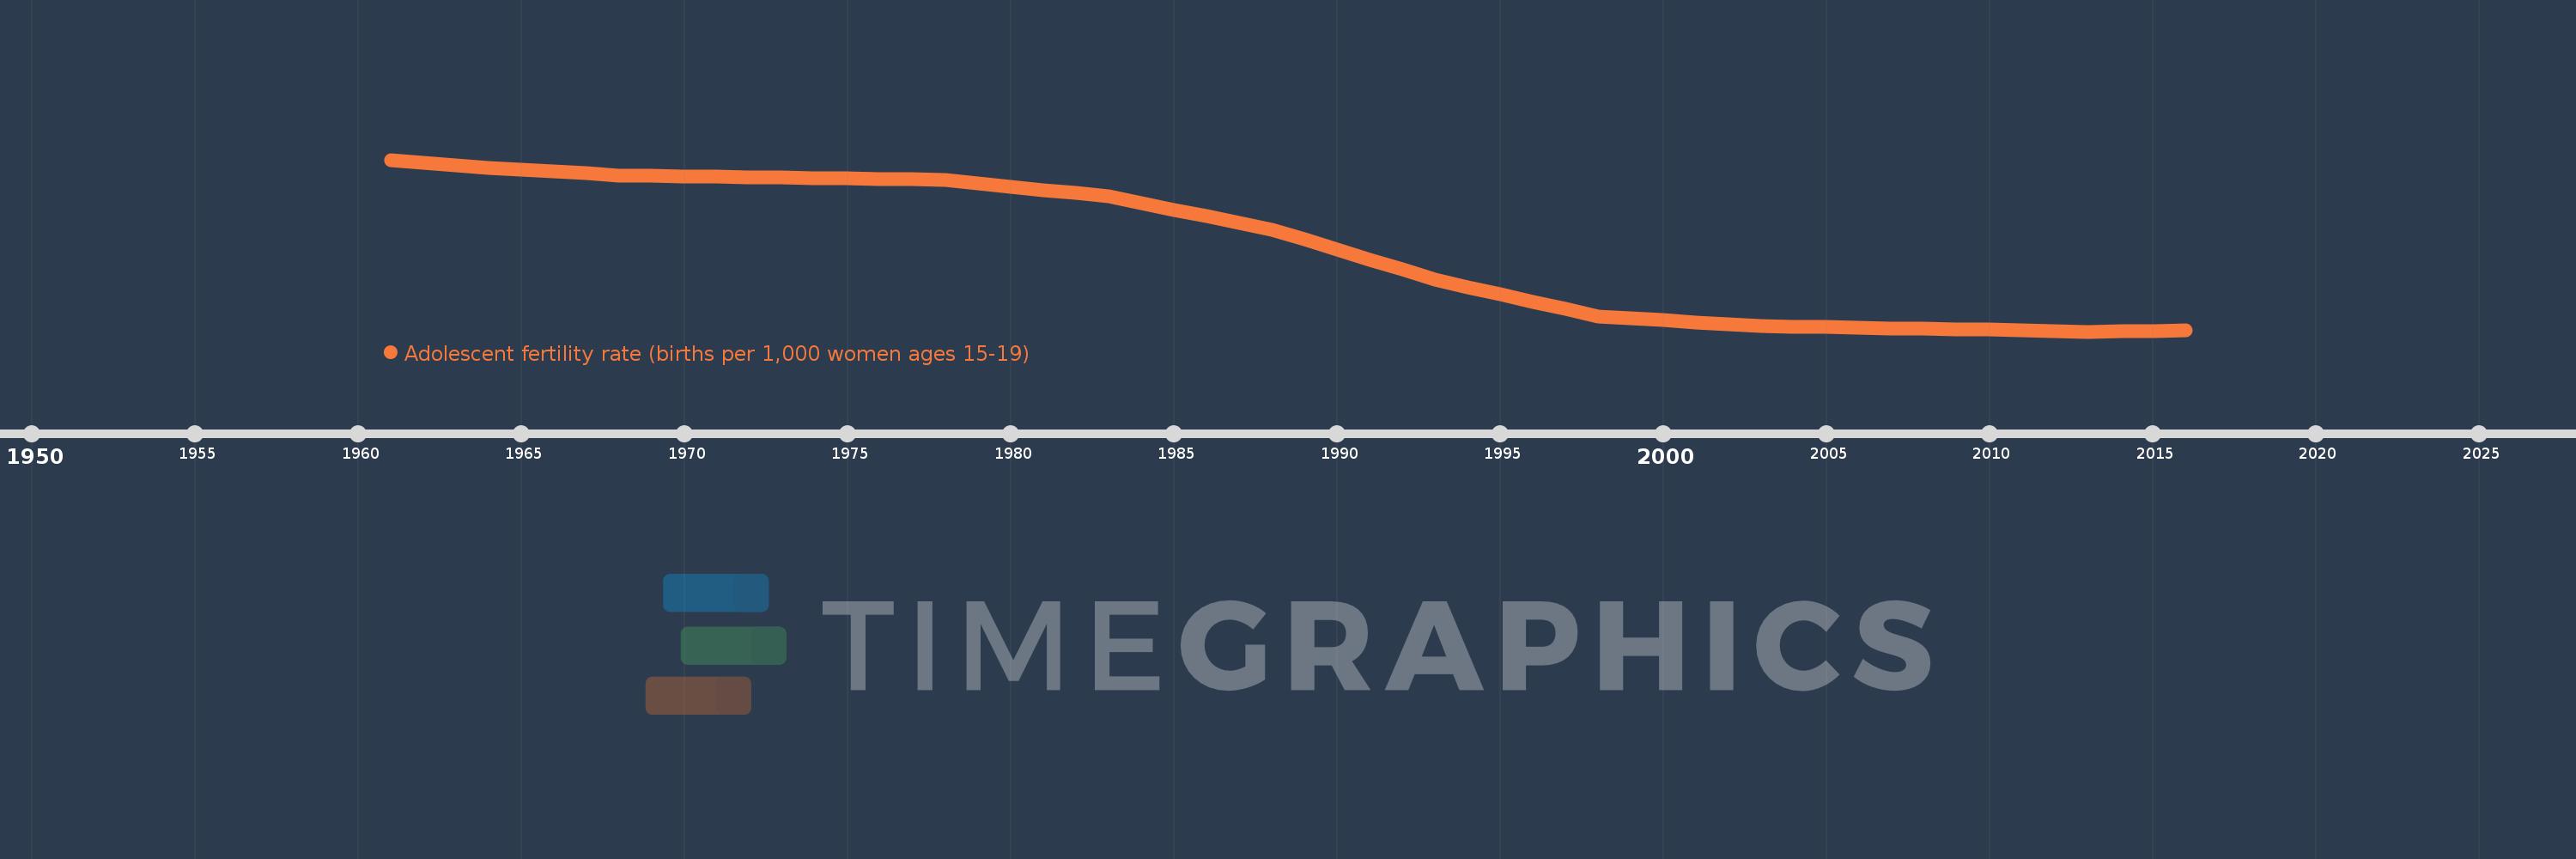
Adolescent fertility rate (births per 1,000 women ages 15-19)
2016,2015,2014,2013,2012,2011,2010,2009,2008,2007,2006,2005,2004,2003,2002,2001,2000,1999,1998,1997,1996,1995,1994,1993,1992,1991,1990,1989,1988,1987,1986,1985,1984,1983,1982,1981,1980,1979,1978,1977,1976,1975,1974,1973,1972,1971,1970,1969,1968,1967,1966,1965,1964,1963,1962,1961
Estas estadísticas en otros países:
AfghanistanAlbaniaAlgeriaAngolaAntigua and BarbudaArab WorldArgentinaArmeniaArubaAustraliaAustriaAzerbaijanBahamas, TheBahrainBangladeshBarbadosBelarusBelgiumBelizeBeninBhutanBoliviaBosnia and HerzegovinaBotswanaBrazilBrunei DarussalamBulgariaBurkina FasoBurundiCabo VerdeCambodiaCameroonCanadaCaribbean small statesCentral African RepublicCentral Europe and the BalticsChadChannel IslandsChileChinaColombiaComorosCongo, Dem. Rep.Congo, Rep.Costa RicaCote d'IvoireCroatiaCubaCuracaoCyprusCzech RepublicDenmarkDjiboutiDominican RepublicEarly-demographic dividendEast Asia & PacificEast Asia & Pacific (excluding high income)East Asia & Pacific (IDA & IBRD countries)EcuadorEgypt, Arab Rep.El SalvadorEquatorial GuineaEritreaEstoniaEthiopiaEuro areaEurope & Central AsiaEurope & Central Asia (excluding high income)Europe & Central Asia (IDA & IBRD countries)European UnionFijiFinlandFragile and conflict affected situationsFranceFrench PolynesiaGabonGambia, TheGeorgiaGermanyGhanaGreeceGrenadaGuamGuatemalaGuineaGuinea-BissauGuyanaHaitiHeavily indebted poor countries (HIPC)High incomeHondurasHong Kong SAR, ChinaHungaryIBRD onlyIcelandIDA & IBRD totalIDA blendIDA onlyIDA totalIndiaIndonesiaIran, Islamic Rep.IraqIrelandIsraelItalyJamaicaJapanJordanKazakhstanKenyaKiribatiKorea, Dem. People’s Rep.Korea, Rep.KuwaitKyrgyz RepublicLao PDRLate-demographic dividendLatin America & Caribbean Latin America & Caribbean (excluding high income)Latin America & the Caribbean (IDA & IBRD countries)LatviaLeast developed countries: UN classificationLebanonLesothoLiberiaLibyaLithuaniaLow & middle incomeLow incomeLower middle incomeLuxembourgMacao SAR, ChinaMacedonia, FYRMadagascarMalawiMalaysiaMaldivesMaliMaltaMauritaniaMauritiusMexicoMicronesia, Fed. Sts.Middle East & North AfricaMiddle East & North Africa (excluding high income)Middle East & North Africa (IDA & IBRD countries)Middle incomeMoldovaMongoliaMontenegroMoroccoMozambiqueMyanmarNamibiaNepalNetherlandsNew CaledoniaNew ZealandNicaraguaNigerNigeriaNorth AmericaNorwayOECD membersOmanOther small statesPacific island small statesPakistanPanamaPapua New GuineaParaguayPeruPhilippinesPolandPortugalPost-demographic dividendPre-demographic dividendPuerto RicoQatarRomaniaRussian FederationRwandaSamoaSao Tome and PrincipeSaudi ArabiaSenegalSerbiaSeychellesSierra LeoneSingaporeSlovak RepublicSloveniaSmall statesSolomon IslandsSomaliaSouth AfricaSouth AsiaSouth Asia (IDA & IBRD)South SudanSpainSri LankaSt. LuciaSt. Vincent and the GrenadinesSub-Saharan Africa Sub-Saharan Africa (excluding high income)Sub-Saharan Africa (IDA & IBRD countries)SudanSurinameSwazilandSwedenSwitzerlandSyrian Arab RepublicTajikistanTanzaniaThailandTimor-LesteTogoTongaTrinidad and TobagoTunisiaTurkeyTurkmenistanUgandaUkraineUnited Arab EmiratesUnited KingdomUnited StatesUpper middle incomeUruguayUzbekistanVanuatuVenezuela, RBVietnamVirgin Islands (U.S.)West Bank and GazaWorldYemen, Rep.ZambiaZimbabwe línea de tiempo (timeline):
En esta escala de tiempo se presenta un gráfico de 1961 y 2016 de Togo. Los datos de 1960 están ausentes. El número de observaciones reales por fecha: 56.
Fuente (nombre):
Indicadores del desarrollo mundial
Fuente (organización):
United Nations Population Division, World Population Prospects.
Categorías:
Health, Gender, Social Development
Se ha actualizado:
23 abr 2017 año
Los indicadores de los cambios de valor en los últimos años
Mínimo:
91.737
1 ene 2013 año
Máximo:
151.148
1 ene 1961 año
A la fecha de observación
Valor
Cambio absoluto
El cambio con respecto al valor anterior
1 ene 1961 año
151.148
+151.148
0.0%
1 ene 1962 año
150.141
-1.008
-0.67%
1 ene 1963 año
149.133
-1.008
-0.67%
1 ene 1964 año
148.453
-0.68
-0.46%
1 ene 1965 año
147.773
-0.68
-0.46%
1 ene 1966 año
147.092
-0.68
-0.46%
1 ene 1967 año
146.412
-0.68
-0.46%
1 ene 1968 año
145.732
-0.68
-0.46%
1 ene 1969 año
145.585
-0.147
-0.1%
1 ene 1970 año
145.438
-0.147
-0.1%
1 ene 1971 año
145.29
-0.147
-0.1%
1 ene 1972 año
145.143
-0.147
-0.1%
1 ene 1973 año
144.996
-0.147
-0.1%
1 ene 1974 año
144.836
-0.16
-0.11%
1 ene 1975 año
144.676
-0.16
-0.11%
1 ene 1976 año
144.516
-0.16
-0.11%
1 ene 1977 año
144.356
-0.16
-0.11%
1 ene 1978 año
144.196
-0.16
-0.11%
1 ene 1979 año
143.042
-1.154
-0.8%
1 ene 1980 año
141.888
-1.154
-0.81%
1 ene 1981 año
140.735
-1.154
-0.81%
1 ene 1982 año
139.581
-1.154
-0.82%
1 ene 1983 año
138.427
-1.154
-0.83%
1 ene 1984 año
136.144
-2.283
-1.65%
1 ene 1985 año
133.862
-2.283
-1.68%
1 ene 1986 año
131.579
-2.283
-1.71%
1 ene 1987 año
129.297
-2.283
-1.73%
1 ene 1988 año
127.014
-2.283
-1.77%
1 ene 1989 año
123.544
-3.47
-2.73%
1 ene 1990 año
120.074
-3.47
-2.81%
1 ene 1991 año
116.603
-3.47
-2.89%
1 ene 1992 año
113.133
-3.47
-2.98%
1 ene 1993 año
109.663
-3.47
-3.07%
1 ene 1994 año
107.126
-2.537
-2.31%
1 ene 1995 año
104.589
-2.537
-2.37%
1 ene 1996 año
102.053
-2.537
-2.43%
1 ene 1997 año
99.516
-2.537
-2.49%
1 ene 1998 año
96.979
-2.537
-2.55%
1 ene 1999 año
96.294
-0.685
-0.71%
1 ene 2000 año
95.608
-0.685
-0.71%
1 ene 2001 año
94.923
-0.685
-0.72%
1 ene 2002 año
94.237
-0.685
-0.72%
1 ene 2003 año
93.552
-0.685
-0.73%
1 ene 2004 año
93.39
-0.162
-0.17%
1 ene 2005 año
93.227
-0.162
-0.17%
1 ene 2006 año
93.065
-0.162
-0.17%
1 ene 2007 año
92.902
-0.162
-0.17%
1 ene 2008 año
92.74
-0.162
-0.17%
1 ene 2009 año
92.539
-0.201
-0.22%
1 ene 2010 año
92.339
-0.201
-0.22%
1 ene 2011 año
92.138
-0.201
-0.22%
1 ene 2012 año
91.938
-0.201
-0.22%
1 ene 2013 año
91.737
-0.201
-0.22%
1 ene 2014 año
91.846
+0.109
0.12%
1 ene 2015 año
91.955
+0.109
0.12%
1 ene 2016 año
92.065
+0.109
0.12%
Ranking de los países por los datos estadísticos actuales


Comentarios: