29
/de/
de
AIzaSyAYiBZKx7MnpbEhh9jyipgxe19OcubqV5w
April 1, 2024
59880
Sub-Saharan Africa (excluding high income)
SSA
false
2
1
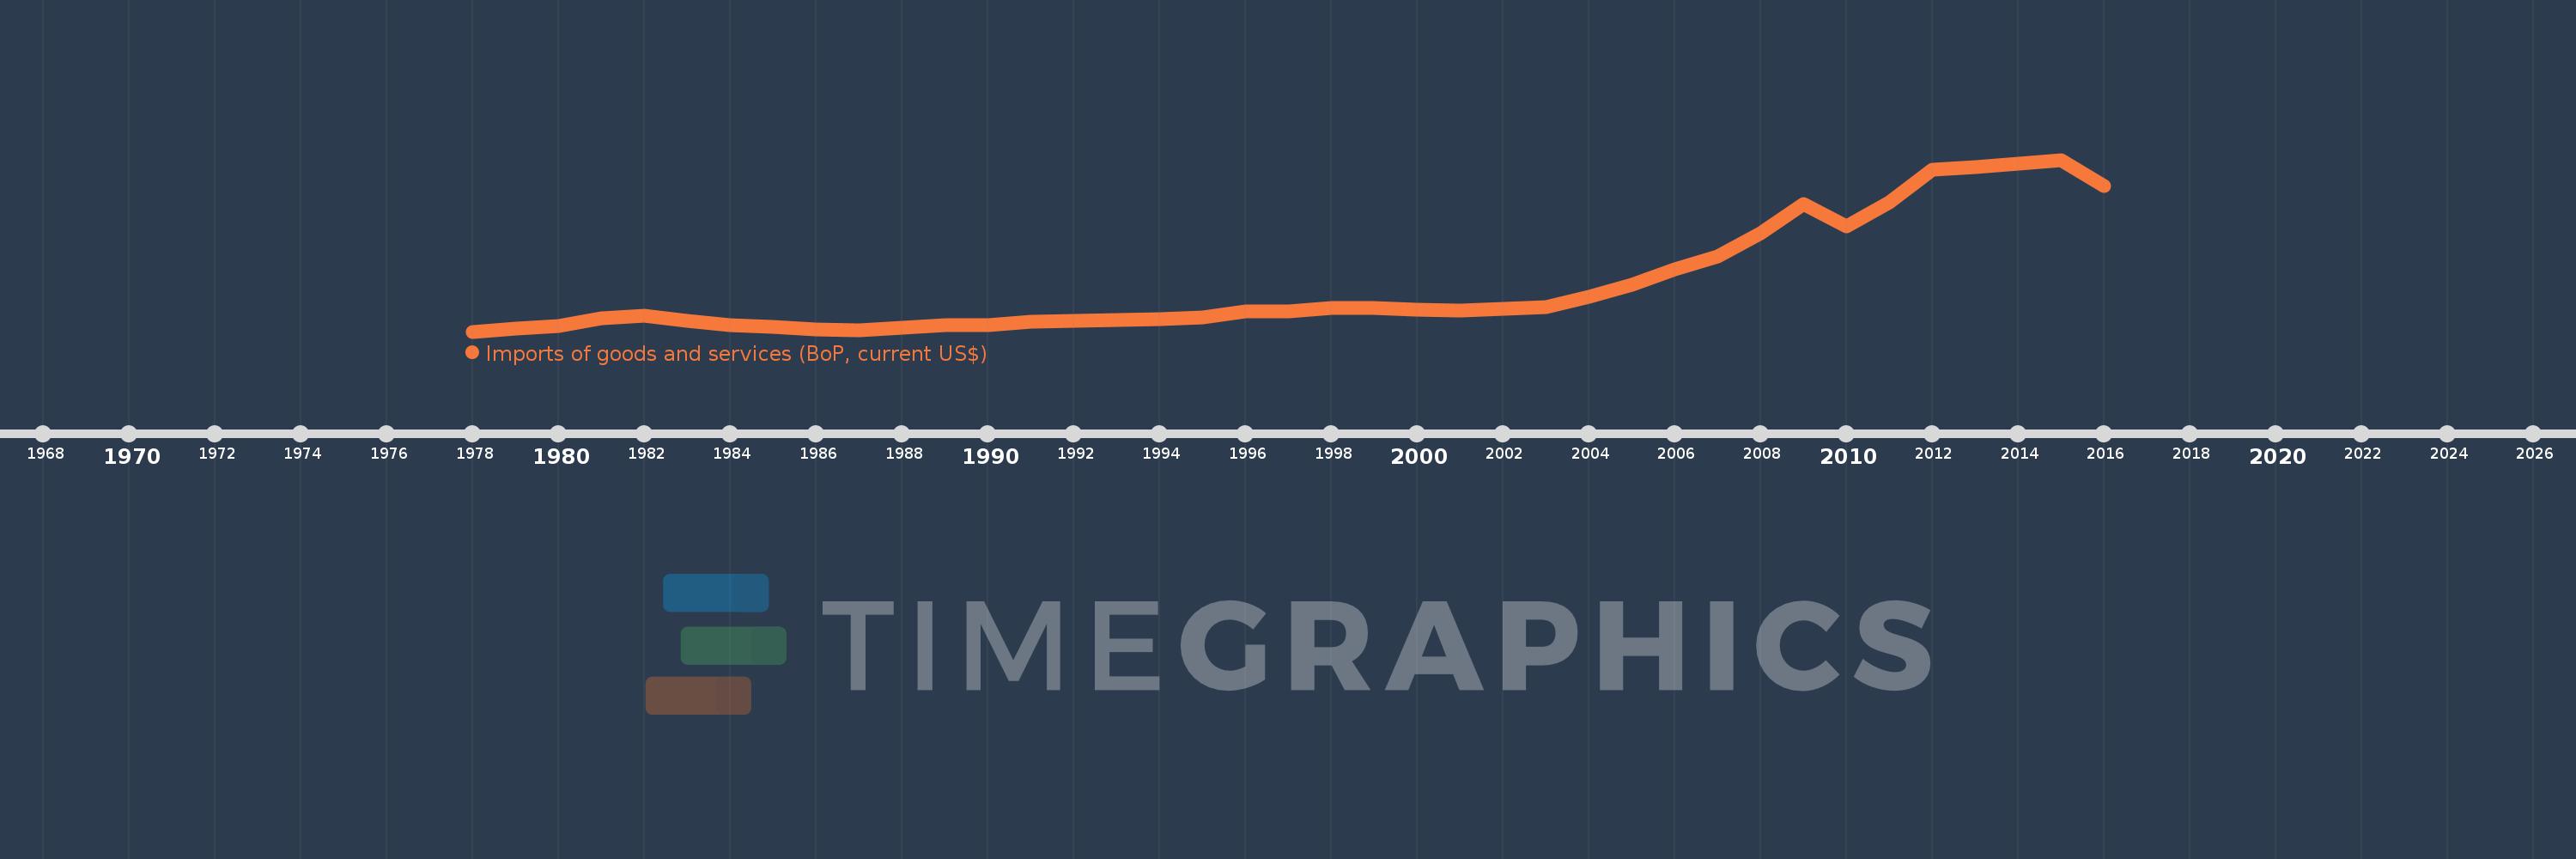
Imports of goods and services (BoP, current US$)
2016,2015,2014,2013,2012,2011,2010,2009,2008,2007,2006,2005,2004,2003,2002,2001,2000,1999,1998,1997,1996,1995,1994,1993,1992,1991,1990,1989,1988,1987,1986,1985,1984,1983,1982,1981,1980,1979,1978
Diese Statistik in anderen Ländern:
AfghanistanAlbaniaAlgeriaAngolaAntigua and BarbudaArab WorldArgentinaArmeniaArubaAustraliaAustriaAzerbaijanBahamas, TheBahrainBangladeshBarbadosBelarusBelgiumBelizeBeninBermudaBhutanBoliviaBosnia and HerzegovinaBotswanaBrazilBrunei DarussalamBulgariaBurkina FasoBurundiCabo VerdeCambodiaCameroonCanadaCaribbean small statesCentral African RepublicCentral Europe and the BalticsChadChileChinaColombiaComorosCongo, Dem. Rep.Congo, Rep.Costa RicaCote d'IvoireCroatiaCuracaoCyprusCzech RepublicDenmarkDjiboutiDominicaDominican RepublicEarly-demographic dividendEast Asia & PacificEast Asia & Pacific (excluding high income)East Asia & Pacific (IDA & IBRD countries)EcuadorEgypt, Arab Rep.El SalvadorEquatorial GuineaEritreaEstoniaEthiopiaEuro areaEurope & Central AsiaEurope & Central Asia (excluding high income)Europe & Central Asia (IDA & IBRD countries)European UnionFaroe IslandsFijiFinlandFragile and conflict affected situationsFranceFrench PolynesiaGabonGambia, TheGeorgiaGermanyGhanaGreeceGrenadaGuatemalaGuineaGuinea-BissauGuyanaHaitiHeavily indebted poor countries (HIPC)High incomeHondurasHong Kong SAR, ChinaHungaryIBRD onlyIcelandIDA & IBRD totalIDA blendIDA onlyIDA totalIndiaIndonesiaIran, Islamic Rep.IraqIrelandIsraelItalyJamaicaJapanJordanKazakhstanKenyaKiribatiKorea, Rep.KosovoKuwaitKyrgyz RepublicLao PDRLate-demographic dividendLatin America & Caribbean Latin America & Caribbean (excluding high income)Latin America & the Caribbean (IDA & IBRD countries)LatviaLeast developed countries: UN classificationLebanonLesothoLiberiaLibyaLithuaniaLow & middle incomeLow incomeLower middle incomeLuxembourgMacao SAR, ChinaMacedonia, FYRMadagascarMalawiMalaysiaMaldivesMaliMaltaMarshall IslandsMauritaniaMauritiusMexicoMicronesia, Fed. Sts.Middle East & North Africa (excluding high income)Middle East & North Africa (IDA & IBRD countries)Middle incomeMoldovaMongoliaMontenegroMoroccoMozambiqueMyanmarNamibiaNepalNetherlandsNew CaledoniaNicaraguaNigerNigeriaNorth AmericaNorwayOECD membersOmanOther small statesPacific island small statesPakistanPalauPanamaPapua New GuineaParaguayPeruPhilippinesPolandPortugalPost-demographic dividendPre-demographic dividendQatarRomaniaRussian FederationRwandaSamoaSao Tome and PrincipeSaudi ArabiaSenegalSerbiaSeychellesSierra LeoneSingaporeSint Maarten (Dutch part)Slovak RepublicSloveniaSmall statesSolomon IslandsSouth AfricaSouth AsiaSouth Asia (IDA & IBRD)South SudanSpainSri LankaSt. Kitts and NevisSt. LuciaSt. Vincent and the GrenadinesSub-Saharan Africa Sub-Saharan Africa (excluding high income)Sub-Saharan Africa (IDA & IBRD countries)SudanSurinameSwazilandSwedenSwitzerlandSyrian Arab RepublicTajikistanTanzaniaThailandTimor-LesteTogoTongaTrinidad and TobagoTunisiaTurkeyTuvaluUgandaUkraineUnited KingdomUnited StatesUpper middle incomeUruguayVanuatuVenezuela, RBVietnamWest Bank and GazaWorldYemen, Rep.ZambiaZimbabwe Zeitlinie:
Diese Zeitleiste vorliegt die Graphik ab 1978 J. bis 2016 J. Sub-Saharan Africa (excluding high income). Die Angaben bis 1977 J. sind nicht vorhanden. Die Zahl aktueller Beobachtungen nach Daten: 39.
Die Quelle (Bezeichnung):
Kennzahlen der Weltentwicklung
Die Quelle (Einrichtung):
International Monetary Fund, Balance of Payments Statistics Yearbook and data files.
Kategorien:
Economy & Growth, Trade
Es wurde aktualisiert:
23 Apr 2017 Jahr
Kennzahlen der Wertänderungen vom Jahr zum Jahr
im Durchschnitt:
173.876 Mlrd.
Minimum:
45.197 Mlrd.
1 Jan 1978 Jahr
Maximum:
522.761 Mlrd.
1 Jan 2015 Jahr
Zum Datum der Beobachtung
Wert
Absolute Veränderung
Die Veränderung bezüglich dem vorherigen Wert
1 Jan 1978 Jahr
45.197 Mlrd.
+45.197 Mlrd.
0.0%
1 Jan 1979 Jahr
52.536 Mlrd.
+7.339 Mlrd.
16.24%
1 Jan 1980 Jahr
59.886 Mlrd.
+7.35 Mlrd.
13.99%
1 Jan 1981 Jahr
81.561 Mlrd.
+21.675 Mlrd.
36.19%
1 Jan 1982 Jahr
90.3 Mlrd.
+8.739 Mlrd.
10.71%
1 Jan 1983 Jahr
73.922 Mlrd.
-16.379 Mlrd.
-18.14%
1 Jan 1984 Jahr
62.755 Mlrd.
-11.167 Mlrd.
-15.11%
1 Jan 1985 Jahr
57.924 Mlrd.
-4.831 Mlrd.
-7.7%
1 Jan 1986 Jahr
51.332 Mlrd.
-6.592 Mlrd.
-11.38%
1 Jan 1987 Jahr
49.064 Mlrd.
-2.268 Mlrd.
-4.42%
1 Jan 1988 Jahr
55.563 Mlrd.
+6.499 Mlrd.
13.25%
1 Jan 1989 Jahr
62.668 Mlrd.
+7.105 Mlrd.
12.79%
1 Jan 1990 Jahr
63.393 Mlrd.
+725.237 Mln.
1.16%
1 Jan 1991 Jahr
71.848 Mlrd.
+8.455 Mlrd.
13.34%
1 Jan 1992 Jahr
74.733 Mlrd.
+2.885 Mlrd.
4.01%
1 Jan 1993 Jahr
77.197 Mlrd.
+2.465 Mlrd.
3.3%
1 Jan 1994 Jahr
78.761 Mlrd.
+1.564 Mlrd.
2.03%
1 Jan 1995 Jahr
85.122 Mlrd.
+6.361 Mlrd.
8.08%
1 Jan 1996 Jahr
100.643 Mlrd.
+15.521 Mlrd.
18.23%
1 Jan 1997 Jahr
101.946 Mlrd.
+1.303 Mlrd.
1.29%
1 Jan 1998 Jahr
110.059 Mlrd.
+8.113 Mlrd.
7.96%
1 Jan 1999 Jahr
110.479 Mlrd.
+419.957 Mln.
0.38%
1 Jan 2000 Jahr
105.436 Mlrd.
-5.043 Mlrd.
-4.57%
1 Jan 2001 Jahr
102.585 Mlrd.
-2.851 Mlrd.
-2.7%
1 Jan 2002 Jahr
108.272 Mlrd.
+5.687 Mlrd.
5.54%
1 Jan 2003 Jahr
112.854 Mlrd.
+4.581 Mlrd.
4.23%
1 Jan 2004 Jahr
142.85 Mlrd.
+29.997 Mlrd.
26.58%
1 Jan 2005 Jahr
174.807 Mlrd.
+31.957 Mlrd.
22.37%
1 Jan 2006 Jahr
218.953 Mlrd.
+44.146 Mlrd.
25.25%
1 Jan 2007 Jahr
254.573 Mlrd.
+35.619 Mlrd.
16.27%
1 Jan 2008 Jahr
318.426 Mlrd.
+63.854 Mlrd.
25.08%
1 Jan 2009 Jahr
400.051 Mlrd.
+81.625 Mlrd.
25.63%
1 Jan 2010 Jahr
337.976 Mlrd.
-62.075 Mlrd.
-15.52%
1 Jan 2011 Jahr
403.583 Mlrd.
+65.607 Mlrd.
19.41%
1 Jan 2012 Jahr
494.668 Mlrd.
+91.085 Mlrd.
22.57%
1 Jan 2013 Jahr
502.984 Mlrd.
+8.316 Mlrd.
1.68%
1 Jan 2014 Jahr
513.039 Mlrd.
+10.055 Mlrd.
2.0%
1 Jan 2015 Jahr
522.761 Mlrd.
+9.722 Mlrd.
1.9%
1 Jan 2016 Jahr
450.458 Mlrd.
-72.303 Mlrd.
-13.83%
Bewertung der Länder gemäß mit laufender Statistik nach Jahren


Kommentare: