29
/de/
de
AIzaSyAYiBZKx7MnpbEhh9jyipgxe19OcubqV5w
April 1, 2024
245716
South Africa
ZAF
true
2
1
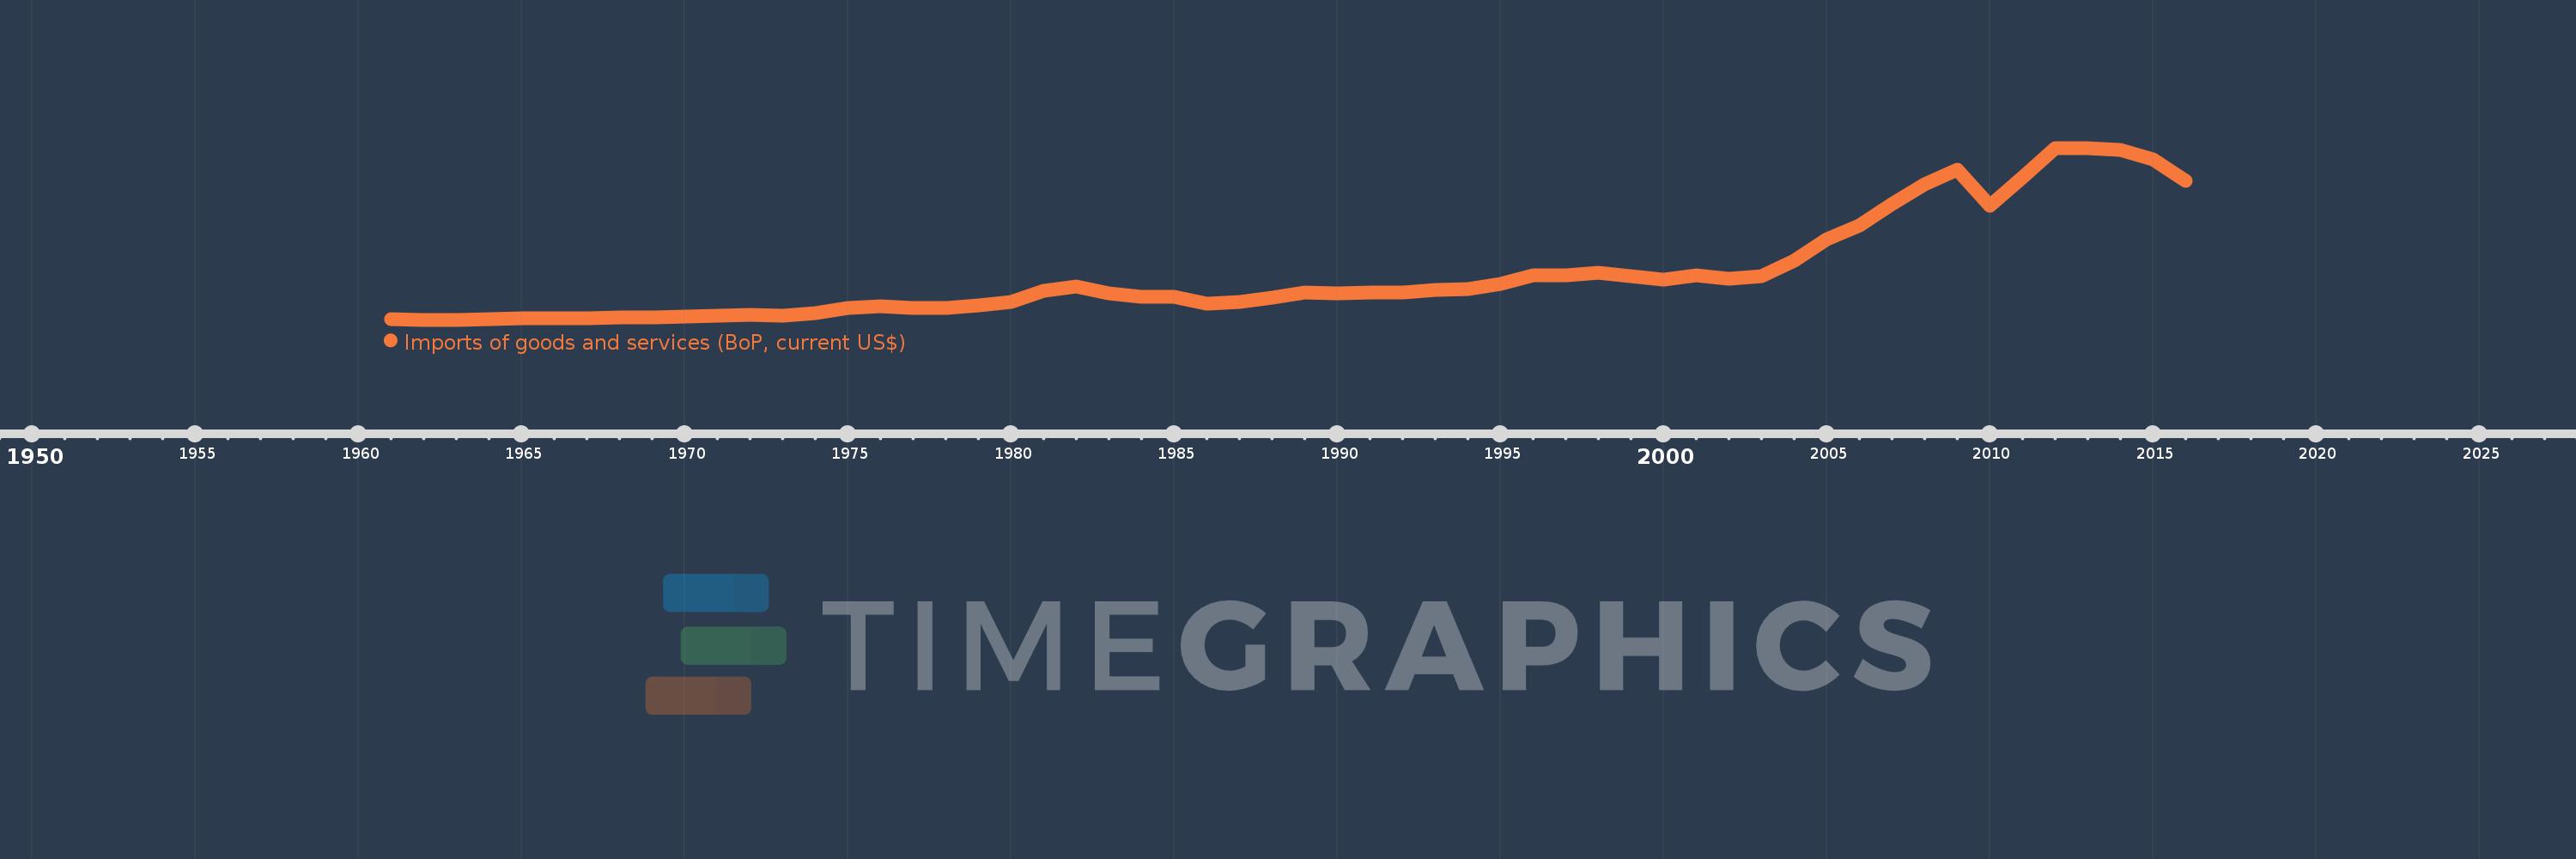
Imports of goods and services (BoP, current US$)
2016,2015,2014,2013,2012,2011,2010,2009,2008,2007,2006,2005,2004,2003,2002,2001,2000,1999,1998,1997,1996,1995,1994,1993,1992,1991,1990,1989,1988,1987,1986,1985,1984,1983,1982,1981,1980,1979,1978,1977,1976,1975,1974,1973,1972,1971,1970,1969,1968,1967,1966,1965,1964,1963,1962,1961
Diese Statistik in anderen Ländern:
AfghanistanAlbaniaAlgeriaAngolaAntigua and BarbudaArab WorldArgentinaArmeniaArubaAustraliaAustriaAzerbaijanBahamas, TheBahrainBangladeshBarbadosBelarusBelgiumBelizeBeninBermudaBhutanBoliviaBosnia and HerzegovinaBotswanaBrazilBrunei DarussalamBulgariaBurkina FasoBurundiCabo VerdeCambodiaCameroonCanadaCaribbean small statesCentral African RepublicCentral Europe and the BalticsChadChileChinaColombiaComorosCongo, Dem. Rep.Congo, Rep.Costa RicaCote d'IvoireCroatiaCuracaoCyprusCzech RepublicDenmarkDjiboutiDominicaDominican RepublicEarly-demographic dividendEast Asia & PacificEast Asia & Pacific (excluding high income)East Asia & Pacific (IDA & IBRD countries)EcuadorEgypt, Arab Rep.El SalvadorEquatorial GuineaEritreaEstoniaEthiopiaEuro areaEurope & Central AsiaEurope & Central Asia (excluding high income)Europe & Central Asia (IDA & IBRD countries)European UnionFaroe IslandsFijiFinlandFragile and conflict affected situationsFranceFrench PolynesiaGabonGambia, TheGeorgiaGermanyGhanaGreeceGrenadaGuatemalaGuineaGuinea-BissauGuyanaHaitiHeavily indebted poor countries (HIPC)High incomeHondurasHong Kong SAR, ChinaHungaryIBRD onlyIcelandIDA & IBRD totalIDA blendIDA onlyIDA totalIndiaIndonesiaIran, Islamic Rep.IraqIrelandIsraelItalyJamaicaJapanJordanKazakhstanKenyaKiribatiKorea, Rep.KosovoKuwaitKyrgyz RepublicLao PDRLate-demographic dividendLatin America & Caribbean Latin America & Caribbean (excluding high income)Latin America & the Caribbean (IDA & IBRD countries)LatviaLeast developed countries: UN classificationLebanonLesothoLiberiaLibyaLithuaniaLow & middle incomeLow incomeLower middle incomeLuxembourgMacao SAR, ChinaMacedonia, FYRMadagascarMalawiMalaysiaMaldivesMaliMaltaMarshall IslandsMauritaniaMauritiusMexicoMicronesia, Fed. Sts.Middle East & North Africa (excluding high income)Middle East & North Africa (IDA & IBRD countries)Middle incomeMoldovaMongoliaMontenegroMoroccoMozambiqueMyanmarNamibiaNepalNetherlandsNew CaledoniaNicaraguaNigerNigeriaNorth AmericaNorwayOECD membersOmanOther small statesPacific island small statesPakistanPalauPanamaPapua New GuineaParaguayPeruPhilippinesPolandPortugalPost-demographic dividendPre-demographic dividendQatarRomaniaRussian FederationRwandaSamoaSao Tome and PrincipeSaudi ArabiaSenegalSerbiaSeychellesSierra LeoneSingaporeSint Maarten (Dutch part)Slovak RepublicSloveniaSmall statesSolomon IslandsSouth AfricaSouth AsiaSouth Asia (IDA & IBRD)South SudanSpainSri LankaSt. Kitts and NevisSt. LuciaSt. Vincent and the GrenadinesSub-Saharan Africa Sub-Saharan Africa (excluding high income)Sub-Saharan Africa (IDA & IBRD countries)SudanSurinameSwazilandSwedenSwitzerlandSyrian Arab RepublicTajikistanTanzaniaThailandTimor-LesteTogoTongaTrinidad and TobagoTunisiaTurkeyTuvaluUgandaUkraineUnited KingdomUnited StatesUpper middle incomeUruguayVanuatuVenezuela, RBVietnamWest Bank and GazaWorldYemen, Rep.ZambiaZimbabwe Zeitlinie:
Diese Zeitleiste vorliegt die Graphik ab 1961 J. bis 2016 J. South Africa. Die Angaben bis 1960 J. sind nicht vorhanden. Die Zahl aktueller Beobachtungen nach Daten: 56.
Die Quelle (Bezeichnung):
Kennzahlen der Weltentwicklung
Die Quelle (Einrichtung):
International Monetary Fund, Balance of Payments Statistics Yearbook and data files.
Kategorien:
Economy & Growth, Trade
Es wurde aktualisiert:
23 Apr 2017 Jahr
Kennzahlen der Wertänderungen vom Jahr zum Jahr
im Durchschnitt:
34.12 Mlrd.
Minimum:
1.698 Mlrd.
1 Jan 1962 Jahr
Maximum:
123.564 Mlrd.
1 Jan 2013 Jahr
Zum Datum der Beobachtung
Wert
Absolute Veränderung
Die Veränderung bezüglich dem vorherigen Wert
1 Jan 1961 Jahr
1.861 Mlrd.
+1.861 Mlrd.
0.0%
1 Jan 1962 Jahr
1.698 Mlrd.
-162.4 Mln.
-8.73%
1 Jan 1963 Jahr
1.756 Mlrd.
+57.4 Mln.
3.38%
1 Jan 1964 Jahr
2.185 Mlrd.
+429.8 Mln.
24.48%
1 Jan 1965 Jahr
2.647 Mlrd.
+462.0 Mln.
21.14%
1 Jan 1966 Jahr
3.035 Mlrd.
+387.8 Mln.
14.65%
1 Jan 1967 Jahr
2.859 Mlrd.
-176.4 Mln.
-5.81%
1 Jan 1968 Jahr
3.338 Mlrd.
+478.8 Mln.
16.75%
1 Jan 1969 Jahr
3.311 Mlrd.
-26.6 Mln.
-0.8%
1 Jan 1970 Jahr
3.77 Mlrd.
+459.2 Mln.
13.87%
1 Jan 1971 Jahr
4.537 Mlrd.
+767.2 Mln.
20.35%
1 Jan 1972 Jahr
5.155 Mlrd.
+617.698 Mln.
13.61%
1 Jan 1973 Jahr
4.737 Mlrd.
-418.479 Mln.
-8.12%
1 Jan 1974 Jahr
6.507 Mlrd.
+1.77 Mlrd.
37.38%
1 Jan 1975 Jahr
10.187 Mlrd.
+3.68 Mlrd.
56.56%
1 Jan 1976 Jahr
11.218 Mlrd.
+1.031 Mlrd.
10.12%
1 Jan 1977 Jahr
10.274 Mlrd.
-943.929 Mln.
-8.41%
1 Jan 1978 Jahr
9.939 Mlrd.
-334.65 Mln.
-3.26%
1 Jan 1979 Jahr
11.625 Mlrd.
+1.686 Mlrd.
16.96%
1 Jan 1980 Jahr
14.44 Mlrd.
+2.815 Mlrd.
24.21%
1 Jan 1981 Jahr
22.143 Mlrd.
+7.703 Mlrd.
53.34%
1 Jan 1982 Jahr
25.125 Mlrd.
+2.982 Mlrd.
13.46%
1 Jan 1983 Jahr
20.496 Mlrd.
-4.628 Mlrd.
-18.42%
1 Jan 1984 Jahr
17.747 Mlrd.
-2.749 Mlrd.
-13.41%
1 Jan 1985 Jahr
18.005 Mlrd.
+257.528 Mln.
1.45%
1 Jan 1986 Jahr
12.997 Mlrd.
-5.008 Mlrd.
-27.82%
1 Jan 1987 Jahr
14.196 Mlrd.
+1.2 Mlrd.
9.23%
1 Jan 1988 Jahr
17.475 Mlrd.
+3.279 Mlrd.
23.1%
1 Jan 1989 Jahr
20.821 Mlrd.
+3.346 Mlrd.
19.15%
1 Jan 1990 Jahr
20.509 Mlrd.
-312.028 Mln.
-1.5%
1 Jan 1991 Jahr
21.017 Mlrd.
+508.034 Mln.
2.48%
1 Jan 1992 Jahr
21.002 Mlrd.
-14.838 Mln.
-0.07%
1 Jan 1993 Jahr
22.607 Mlrd.
+1.605 Mlrd.
7.64%
1 Jan 1994 Jahr
23.193 Mlrd.
+585.987 Mln.
2.59%
1 Jan 1995 Jahr
26.941 Mlrd.
+3.748 Mlrd.
16.16%
1 Jan 1996 Jahr
33.375 Mlrd.
+6.434 Mlrd.
23.88%
1 Jan 1997 Jahr
33.303 Mlrd.
-72.03 Mln.
-0.22%
1 Jan 1998 Jahr
34.851 Mlrd.
+1.548 Mlrd.
4.65%
1 Jan 1999 Jahr
32.865 Mlrd.
-1.986 Mlrd.
-5.7%
1 Jan 2000 Jahr
30.284 Mlrd.
-2.581 Mlrd.
-7.85%
1 Jan 2001 Jahr
33.075 Mlrd.
+2.791 Mlrd.
9.22%
1 Jan 2002 Jahr
31.041 Mlrd.
-2.034 Mlrd.
-6.15%
1 Jan 2003 Jahr
32.52 Mlrd.
+1.479 Mlrd.
4.76%
1 Jan 2004 Jahr
43.312 Mlrd.
+10.792 Mlrd.
33.19%
1 Jan 2005 Jahr
58.846 Mlrd.
+15.534 Mlrd.
35.87%
1 Jan 2006 Jahr
68.723 Mlrd.
+9.877 Mlrd.
16.78%
1 Jan 2007 Jahr
83.772 Mlrd.
+15.049 Mlrd.
21.9%
1 Jan 2008 Jahr
97.508 Mlrd.
+13.736 Mlrd.
16.4%
1 Jan 2009 Jahr
107.976 Mlrd.
+10.468 Mlrd.
10.74%
1 Jan 2010 Jahr
82.279 Mlrd.
-25.696 Mlrd.
-23.8%
1 Jan 2011 Jahr
102.954 Mlrd.
+20.674 Mlrd.
25.13%
1 Jan 2012 Jahr
123.424 Mlrd.
+20.471 Mlrd.
19.88%
1 Jan 2013 Jahr
123.564 Mlrd.
+139.993 Mln.
0.11%
1 Jan 2014 Jahr
121.958 Mlrd.
-1.606 Mlrd.
-1.3%
1 Jan 2015 Jahr
115.639 Mlrd.
-6.319 Mlrd.
-5.18%
1 Jan 2016 Jahr
100.098 Mlrd.
-15.541 Mlrd.
-13.44%
Bewertung der Länder gemäß mit laufender Statistik nach Jahren


Kommentare: