29
/de/
de
AIzaSyAYiBZKx7MnpbEhh9jyipgxe19OcubqV5w
April 1, 2024
262372
Thailand
THA
true
2
1
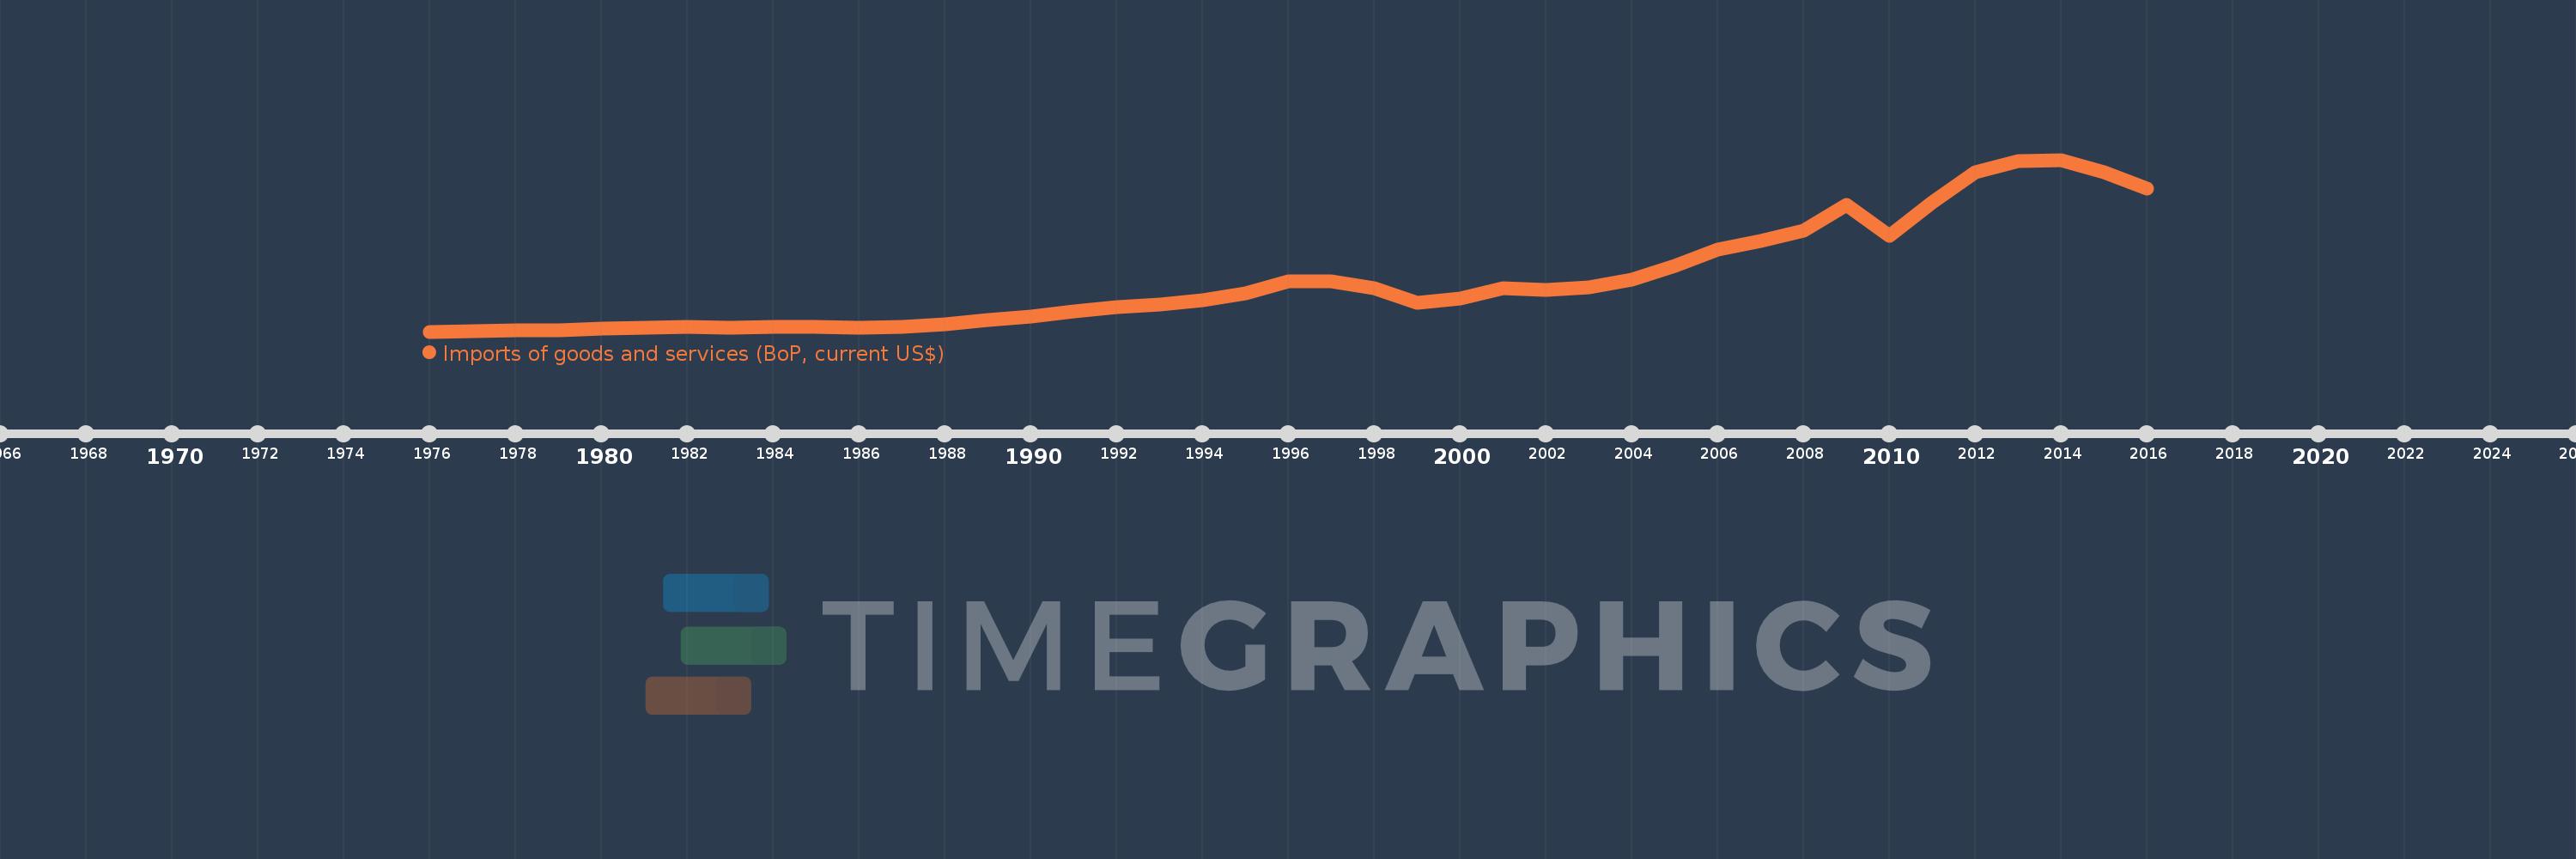
Imports of goods and services (BoP, current US$)
2016,2015,2014,2013,2012,2011,2010,2009,2008,2007,2006,2005,2004,2003,2002,2001,2000,1999,1998,1997,1996,1995,1994,1993,1992,1991,1990,1989,1988,1987,1986,1985,1984,1983,1982,1981,1980,1979,1978,1977,1976
Diese Statistik in anderen Ländern:
AfghanistanAlbaniaAlgeriaAngolaAntigua and BarbudaArab WorldArgentinaArmeniaArubaAustraliaAustriaAzerbaijanBahamas, TheBahrainBangladeshBarbadosBelarusBelgiumBelizeBeninBermudaBhutanBoliviaBosnia and HerzegovinaBotswanaBrazilBrunei DarussalamBulgariaBurkina FasoBurundiCabo VerdeCambodiaCameroonCanadaCaribbean small statesCentral African RepublicCentral Europe and the BalticsChadChileChinaColombiaComorosCongo, Dem. Rep.Congo, Rep.Costa RicaCote d'IvoireCroatiaCuracaoCyprusCzech RepublicDenmarkDjiboutiDominicaDominican RepublicEarly-demographic dividendEast Asia & PacificEast Asia & Pacific (excluding high income)East Asia & Pacific (IDA & IBRD countries)EcuadorEgypt, Arab Rep.El SalvadorEquatorial GuineaEritreaEstoniaEthiopiaEuro areaEurope & Central AsiaEurope & Central Asia (excluding high income)Europe & Central Asia (IDA & IBRD countries)European UnionFaroe IslandsFijiFinlandFragile and conflict affected situationsFranceFrench PolynesiaGabonGambia, TheGeorgiaGermanyGhanaGreeceGrenadaGuatemalaGuineaGuinea-BissauGuyanaHaitiHeavily indebted poor countries (HIPC)High incomeHondurasHong Kong SAR, ChinaHungaryIBRD onlyIcelandIDA & IBRD totalIDA blendIDA onlyIDA totalIndiaIndonesiaIran, Islamic Rep.IraqIrelandIsraelItalyJamaicaJapanJordanKazakhstanKenyaKiribatiKorea, Rep.KosovoKuwaitKyrgyz RepublicLao PDRLate-demographic dividendLatin America & Caribbean Latin America & Caribbean (excluding high income)Latin America & the Caribbean (IDA & IBRD countries)LatviaLeast developed countries: UN classificationLebanonLesothoLiberiaLibyaLithuaniaLow & middle incomeLow incomeLower middle incomeLuxembourgMacao SAR, ChinaMacedonia, FYRMadagascarMalawiMalaysiaMaldivesMaliMaltaMarshall IslandsMauritaniaMauritiusMexicoMicronesia, Fed. Sts.Middle East & North Africa (excluding high income)Middle East & North Africa (IDA & IBRD countries)Middle incomeMoldovaMongoliaMontenegroMoroccoMozambiqueMyanmarNamibiaNepalNetherlandsNew CaledoniaNicaraguaNigerNigeriaNorth AmericaNorwayOECD membersOmanOther small statesPacific island small statesPakistanPalauPanamaPapua New GuineaParaguayPeruPhilippinesPolandPortugalPost-demographic dividendPre-demographic dividendQatarRomaniaRussian FederationRwandaSamoaSao Tome and PrincipeSaudi ArabiaSenegalSerbiaSeychellesSierra LeoneSingaporeSint Maarten (Dutch part)Slovak RepublicSloveniaSmall statesSolomon IslandsSouth AfricaSouth AsiaSouth Asia (IDA & IBRD)South SudanSpainSri LankaSt. Kitts and NevisSt. LuciaSt. Vincent and the GrenadinesSub-Saharan Africa Sub-Saharan Africa (excluding high income)Sub-Saharan Africa (IDA & IBRD countries)SudanSurinameSwazilandSwedenSwitzerlandSyrian Arab RepublicTajikistanTanzaniaThailandTimor-LesteTogoTongaTrinidad and TobagoTunisiaTurkeyTuvaluUgandaUkraineUnited KingdomUnited StatesUpper middle incomeUruguayVanuatuVenezuela, RBVietnamWest Bank and GazaWorldYemen, Rep.ZambiaZimbabwe Zeitlinie:
Diese Zeitleiste vorliegt die Graphik ab 1976 J. bis 2016 J. Thailand. Die Angaben bis 1975 J. sind nicht vorhanden. Die Zahl aktueller Beobachtungen nach Daten: 41.
Die Quelle (Bezeichnung):
Kennzahlen der Weltentwicklung
Die Quelle (Einrichtung):
International Monetary Fund, Balance of Payments Statistics Yearbook and data files.
Kategorien:
Economy & Growth, Trade
Es wurde aktualisiert:
23 Apr 2017 Jahr
Kennzahlen der Wertänderungen vom Jahr zum Jahr
im Durchschnitt:
84.155 Mlrd.
Minimum:
3.478 Mlrd.
1 Jan 1976 Jahr
Maximum:
274.809 Mlrd.
1 Jan 2014 Jahr
Zum Datum der Beobachtung
Wert
Absolute Veränderung
Die Veränderung bezüglich dem vorherigen Wert
1 Jan 1976 Jahr
3.478 Mlrd.
+3.478 Mlrd.
0.0%
1 Jan 1977 Jahr
3.9 Mlrd.
+421.74 Mln.
12.13%
1 Jan 1978 Jahr
5.083 Mlrd.
+1.184 Mlrd.
30.35%
1 Jan 1979 Jahr
5.908 Mlrd.
+825.037 Mln.
16.23%
1 Jan 1980 Jahr
8.137 Mlrd.
+2.228 Mlrd.
37.71%
1 Jan 1981 Jahr
9.996 Mlrd.
+1.859 Mlrd.
22.85%
1 Jan 1982 Jahr
10.75 Mlrd.
+753.778 Mln.
7.54%
1 Jan 1983 Jahr
9.223 Mlrd.
-1.526 Mlrd.
-14.2%
1 Jan 1984 Jahr
11.078 Mlrd.
+1.854 Mlrd.
20.1%
1 Jan 1985 Jahr
11.145 Mlrd.
+67.732 Mln.
0.61%
1 Jan 1986 Jahr
10.206 Mlrd.
-939.507 Mln.
-8.43%
1 Jan 1987 Jahr
10.266 Mlrd.
+60.604 Mln.
0.59%
1 Jan 1988 Jahr
14.425 Mlrd.
+4.159 Mlrd.
40.51%
1 Jan 1989 Jahr
21.425 Mlrd.
+7.0 Mlrd.
48.52%
1 Jan 1990 Jahr
27.255 Mlrd.
+5.83 Mlrd.
27.21%
1 Jan 1991 Jahr
35.87 Mlrd.
+8.616 Mlrd.
31.61%
1 Jan 1992 Jahr
42.261 Mlrd.
+6.391 Mlrd.
17.82%
1 Jan 1993 Jahr
46.629 Mlrd.
+4.367 Mlrd.
10.33%
1 Jan 1994 Jahr
53.163 Mlrd.
+6.535 Mlrd.
14.01%
1 Jan 1995 Jahr
63.6 Mlrd.
+10.436 Mlrd.
19.63%
1 Jan 1996 Jahr
82.246 Mlrd.
+18.647 Mlrd.
29.32%
1 Jan 1997 Jahr
83.482 Mlrd.
+1.235 Mlrd.
1.5%
1 Jan 1998 Jahr
72.439 Mlrd.
-11.043 Mlrd.
-13.23%
1 Jan 1999 Jahr
48.513 Mlrd.
-23.926 Mlrd.
-33.03%
1 Jan 2000 Jahr
56.345 Mlrd.
+7.831 Mlrd.
16.14%
1 Jan 2001 Jahr
71.653 Mlrd.
+15.309 Mlrd.
27.17%
1 Jan 2002 Jahr
69.149 Mlrd.
-2.504 Mlrd.
-3.49%
1 Jan 2003 Jahr
73.729 Mlrd.
+4.579 Mlrd.
6.62%
1 Jan 2004 Jahr
85.078 Mlrd.
+11.349 Mlrd.
15.39%
1 Jan 2005 Jahr
107.271 Mlrd.
+22.193 Mlrd.
26.09%
1 Jan 2006 Jahr
132.758 Mlrd.
+25.488 Mlrd.
23.76%
1 Jan 2007 Jahr
146.885 Mlrd.
+14.127 Mlrd.
10.64%
1 Jan 2008 Jahr
162.689 Mlrd.
+15.804 Mlrd.
10.76%
1 Jan 2009 Jahr
203.906 Mlrd.
+41.217 Mlrd.
25.33%
1 Jan 2010 Jahr
154.991 Mlrd.
-48.915 Mlrd.
-23.99%
1 Jan 2011 Jahr
207.559 Mlrd.
+52.567 Mlrd.
33.92%
1 Jan 2012 Jahr
255.311 Mlrd.
+47.752 Mlrd.
23.01%
1 Jan 2013 Jahr
273.297 Mlrd.
+17.986 Mlrd.
7.04%
1 Jan 2014 Jahr
274.809 Mlrd.
+1.512 Mlrd.
0.55%
1 Jan 2015 Jahr
254.669 Mlrd.
-20.14 Mlrd.
-7.33%
1 Jan 2016 Jahr
229.766 Mlrd.
-24.903 Mlrd.
-9.78%
Bewertung der Länder gemäß mit laufender Statistik nach Jahren


Kommentare: