29
/de/
de
AIzaSyAYiBZKx7MnpbEhh9jyipgxe19OcubqV5w
April 1, 2024
256454
Sweden
SWE
true
2
1
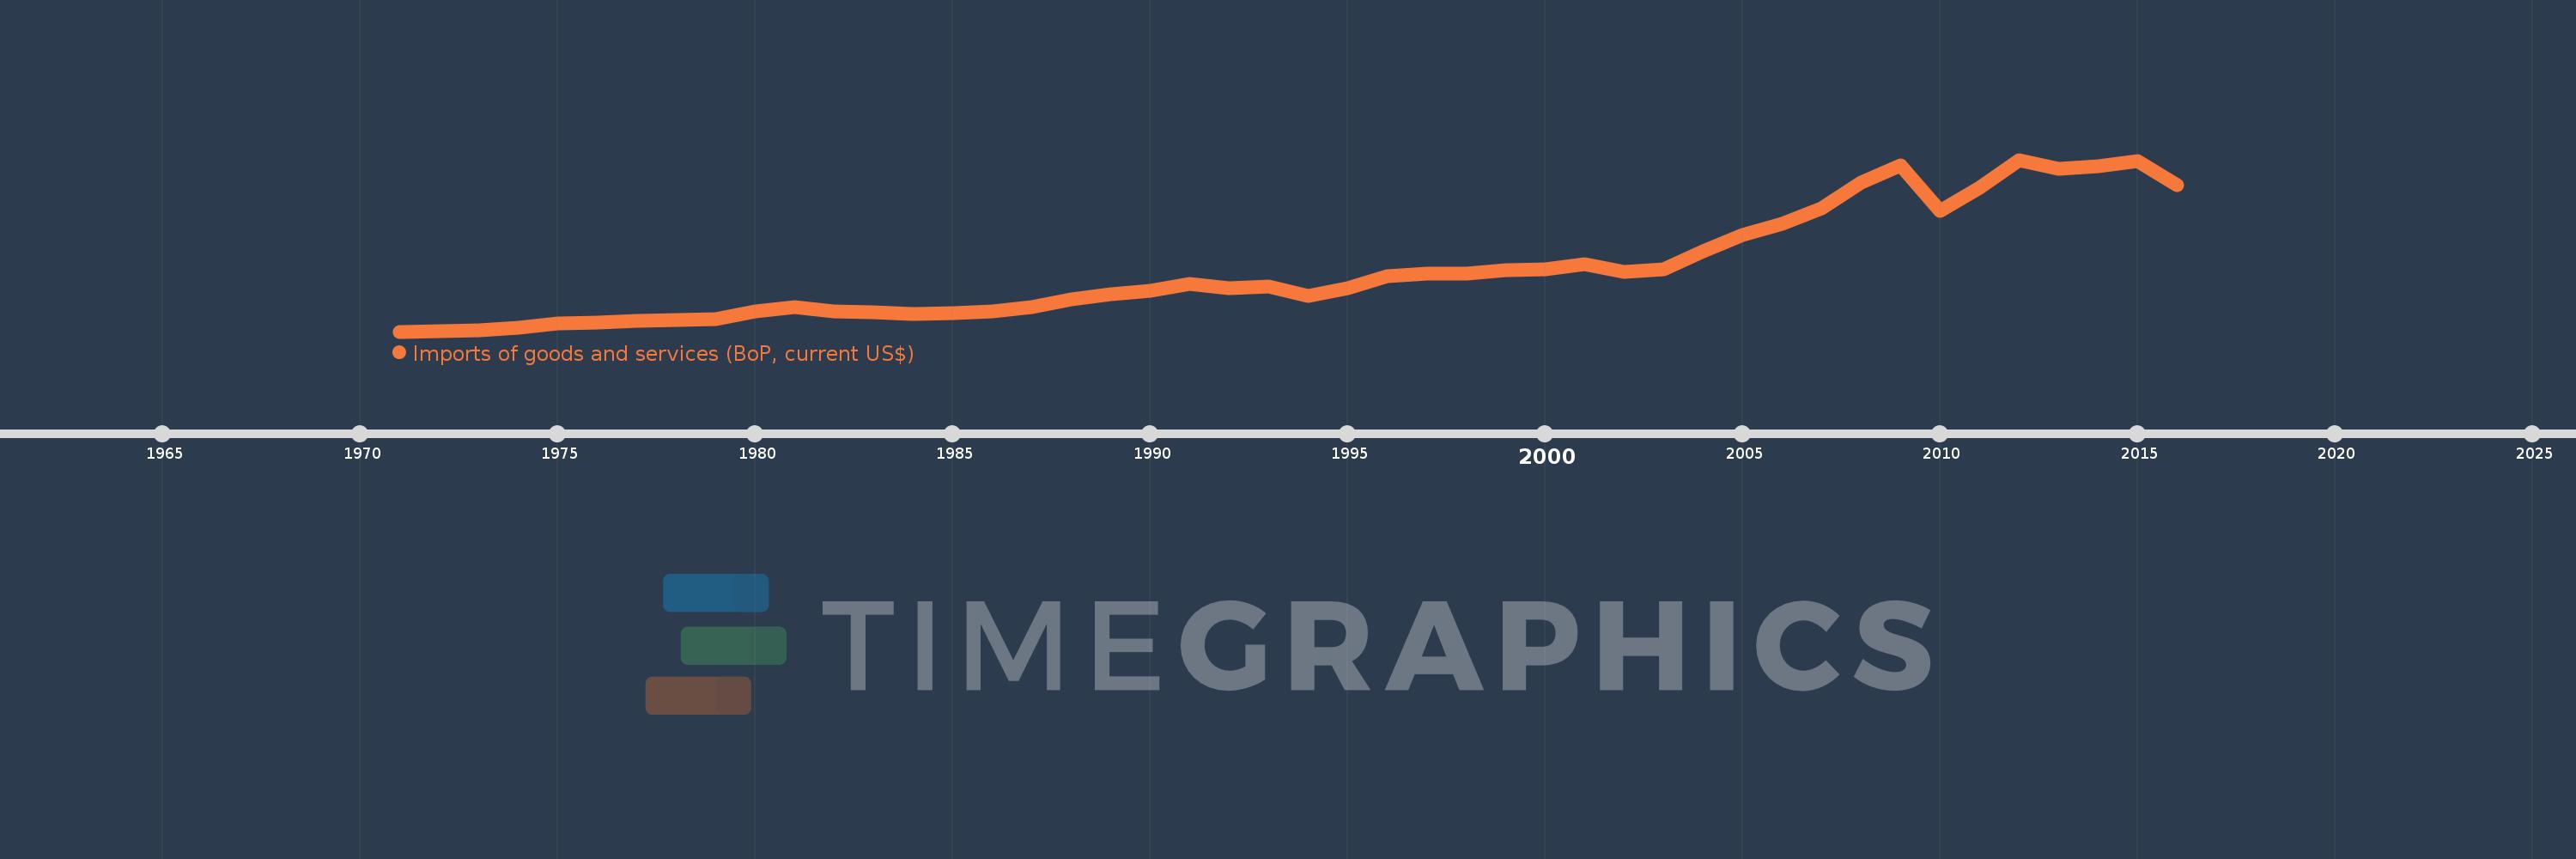
Imports of goods and services (BoP, current US$)
2016,2015,2014,2013,2012,2011,2010,2009,2008,2007,2006,2005,2004,2003,2002,2001,2000,1999,1998,1997,1996,1995,1994,1993,1992,1991,1990,1989,1988,1987,1986,1985,1984,1983,1982,1981,1980,1979,1978,1977,1976,1975,1974,1973,1972,1971
Diese Statistik in anderen Ländern:
AfghanistanAlbaniaAlgeriaAngolaAntigua and BarbudaArab WorldArgentinaArmeniaArubaAustraliaAustriaAzerbaijanBahamas, TheBahrainBangladeshBarbadosBelarusBelgiumBelizeBeninBermudaBhutanBoliviaBosnia and HerzegovinaBotswanaBrazilBrunei DarussalamBulgariaBurkina FasoBurundiCabo VerdeCambodiaCameroonCanadaCaribbean small statesCentral African RepublicCentral Europe and the BalticsChadChileChinaColombiaComorosCongo, Dem. Rep.Congo, Rep.Costa RicaCote d'IvoireCroatiaCuracaoCyprusCzech RepublicDenmarkDjiboutiDominicaDominican RepublicEarly-demographic dividendEast Asia & PacificEast Asia & Pacific (excluding high income)East Asia & Pacific (IDA & IBRD countries)EcuadorEgypt, Arab Rep.El SalvadorEquatorial GuineaEritreaEstoniaEthiopiaEuro areaEurope & Central AsiaEurope & Central Asia (excluding high income)Europe & Central Asia (IDA & IBRD countries)European UnionFaroe IslandsFijiFinlandFragile and conflict affected situationsFranceFrench PolynesiaGabonGambia, TheGeorgiaGermanyGhanaGreeceGrenadaGuatemalaGuineaGuinea-BissauGuyanaHaitiHeavily indebted poor countries (HIPC)High incomeHondurasHong Kong SAR, ChinaHungaryIBRD onlyIcelandIDA & IBRD totalIDA blendIDA onlyIDA totalIndiaIndonesiaIran, Islamic Rep.IraqIrelandIsraelItalyJamaicaJapanJordanKazakhstanKenyaKiribatiKorea, Rep.KosovoKuwaitKyrgyz RepublicLao PDRLate-demographic dividendLatin America & Caribbean Latin America & Caribbean (excluding high income)Latin America & the Caribbean (IDA & IBRD countries)LatviaLeast developed countries: UN classificationLebanonLesothoLiberiaLibyaLithuaniaLow & middle incomeLow incomeLower middle incomeLuxembourgMacao SAR, ChinaMacedonia, FYRMadagascarMalawiMalaysiaMaldivesMaliMaltaMarshall IslandsMauritaniaMauritiusMexicoMicronesia, Fed. Sts.Middle East & North Africa (excluding high income)Middle East & North Africa (IDA & IBRD countries)Middle incomeMoldovaMongoliaMontenegroMoroccoMozambiqueMyanmarNamibiaNepalNetherlandsNew CaledoniaNicaraguaNigerNigeriaNorth AmericaNorwayOECD membersOmanOther small statesPacific island small statesPakistanPalauPanamaPapua New GuineaParaguayPeruPhilippinesPolandPortugalPost-demographic dividendPre-demographic dividendQatarRomaniaRussian FederationRwandaSamoaSao Tome and PrincipeSaudi ArabiaSenegalSerbiaSeychellesSierra LeoneSingaporeSint Maarten (Dutch part)Slovak RepublicSloveniaSmall statesSolomon IslandsSouth AfricaSouth AsiaSouth Asia (IDA & IBRD)South SudanSpainSri LankaSt. Kitts and NevisSt. LuciaSt. Vincent and the GrenadinesSub-Saharan Africa Sub-Saharan Africa (excluding high income)Sub-Saharan Africa (IDA & IBRD countries)SudanSurinameSwazilandSwedenSwitzerlandSyrian Arab RepublicTajikistanTanzaniaThailandTimor-LesteTogoTongaTrinidad and TobagoTunisiaTurkeyTuvaluUgandaUkraineUnited KingdomUnited StatesUpper middle incomeUruguayVanuatuVenezuela, RBVietnamWest Bank and GazaWorldYemen, Rep.ZambiaZimbabwe Zeitlinie:
Diese Zeitleiste vorliegt die Graphik ab 1971 J. bis 2016 J. Sweden. Die Angaben bis 1970 J. sind nicht vorhanden. Die Zahl aktueller Beobachtungen nach Daten: 46.
Die Quelle (Bezeichnung):
Kennzahlen der Weltentwicklung
Die Quelle (Einrichtung):
International Monetary Fund, Balance of Payments Statistics Yearbook and data files.
Kategorien:
Economy & Growth, Trade
Es wurde aktualisiert:
23 Apr 2017 Jahr
Kennzahlen der Wertänderungen vom Jahr zum Jahr
im Durchschnitt:
88.989 Mlrd.
Minimum:
8.223 Mlrd.
1 Jan 1971 Jahr
Maximum:
233.117 Mlrd.
1 Jan 2012 Jahr
Zum Datum der Beobachtung
Wert
Absolute Veränderung
Die Veränderung bezüglich dem vorherigen Wert
1 Jan 1971 Jahr
8.223 Mlrd.
+8.223 Mlrd.
0.0%
1 Jan 1972 Jahr
8.465 Mlrd.
+241.712 Mln.
2.94%
1 Jan 1973 Jahr
9.764 Mlrd.
+1.299 Mlrd.
15.35%
1 Jan 1974 Jahr
12.841 Mlrd.
+3.077 Mlrd.
31.51%
1 Jan 1975 Jahr
18.96 Mlrd.
+6.119 Mlrd.
47.65%
1 Jan 1976 Jahr
20.325 Mlrd.
+1.366 Mlrd.
7.2%
1 Jan 1977 Jahr
22.641 Mlrd.
+2.316 Mlrd.
11.39%
1 Jan 1978 Jahr
23.691 Mlrd.
+1.05 Mlrd.
4.64%
1 Jan 1979 Jahr
24.633 Mlrd.
+942.377 Mln.
3.98%
1 Jan 1980 Jahr
34.542 Mlrd.
+9.909 Mlrd.
40.23%
1 Jan 1981 Jahr
39.878 Mlrd.
+5.335 Mlrd.
15.45%
1 Jan 1982 Jahr
35.089 Mlrd.
-4.789 Mlrd.
-12.01%
1 Jan 1983 Jahr
33.706 Mlrd.
-1.382 Mlrd.
-3.94%
1 Jan 1984 Jahr
31.528 Mlrd.
-2.179 Mlrd.
-6.46%
1 Jan 1985 Jahr
32.035 Mlrd.
+507.328 Mln.
1.61%
1 Jan 1986 Jahr
34.469 Mlrd.
+2.434 Mlrd.
7.6%
1 Jan 1987 Jahr
40.274 Mlrd.
+5.804 Mlrd.
16.84%
1 Jan 1988 Jahr
50.134 Mlrd.
+9.86 Mlrd.
24.48%
1 Jan 1989 Jahr
57.149 Mlrd.
+7.016 Mlrd.
13.99%
1 Jan 1990 Jahr
61.442 Mlrd.
+4.293 Mlrd.
7.51%
1 Jan 1991 Jahr
70.46 Mlrd.
+9.018 Mlrd.
14.68%
1 Jan 1992 Jahr
65.538 Mlrd.
-4.922 Mlrd.
-6.99%
1 Jan 1993 Jahr
67.558 Mlrd.
+2.02 Mlrd.
3.08%
1 Jan 1994 Jahr
55.003 Mlrd.
-12.555 Mlrd.
-18.58%
1 Jan 1995 Jahr
65.116 Mlrd.
+10.112 Mlrd.
18.39%
1 Jan 1996 Jahr
80.871 Mlrd.
+15.756 Mlrd.
24.2%
1 Jan 1997 Jahr
84.533 Mlrd.
+3.661 Mlrd.
4.53%
1 Jan 1998 Jahr
84.44 Mlrd.
-92.896 Mln.
-0.11%
1 Jan 1999 Jahr
89.076 Mlrd.
+4.636 Mlrd.
5.49%
1 Jan 2000 Jahr
90.162 Mlrd.
+1.086 Mlrd.
1.22%
1 Jan 2001 Jahr
96.166 Mlrd.
+6.005 Mlrd.
6.66%
1 Jan 2002 Jahr
86.611 Mlrd.
-9.555 Mlrd.
-9.94%
1 Jan 2003 Jahr
90.213 Mlrd.
+3.602 Mlrd.
4.16%
1 Jan 2004 Jahr
112.927 Mlrd.
+22.713 Mlrd.
25.18%
1 Jan 2005 Jahr
134.285 Mlrd.
+21.358 Mlrd.
18.91%
1 Jan 2006 Jahr
149.176 Mlrd.
+14.891 Mlrd.
11.09%
1 Jan 2007 Jahr
169.381 Mlrd.
+20.205 Mlrd.
13.54%
1 Jan 2008 Jahr
203.537 Mlrd.
+34.156 Mlrd.
20.16%
1 Jan 2009 Jahr
225.988 Mlrd.
+22.451 Mlrd.
11.03%
1 Jan 2010 Jahr
166.646 Mlrd.
-59.342 Mlrd.
-26.26%
1 Jan 2011 Jahr
196.604 Mlrd.
+29.958 Mlrd.
17.98%
1 Jan 2012 Jahr
233.117 Mlrd.
+36.512 Mlrd.
18.57%
1 Jan 2013 Jahr
220.852 Mlrd.
-12.264 Mlrd.
-5.26%
1 Jan 2014 Jahr
224.175 Mlrd.
+3.323 Mlrd.
1.5%
1 Jan 2015 Jahr
231.236 Mlrd.
+7.06 Mlrd.
3.15%
1 Jan 2016 Jahr
200.032 Mlrd.
-31.204 Mlrd.
-13.49%
Bewertung der Länder gemäß mit laufender Statistik nach Jahren


Kommentare: