29
/de/
de
AIzaSyAYiBZKx7MnpbEhh9jyipgxe19OcubqV5w
April 1, 2024
171817
Kuwait
KWT
true
2
1
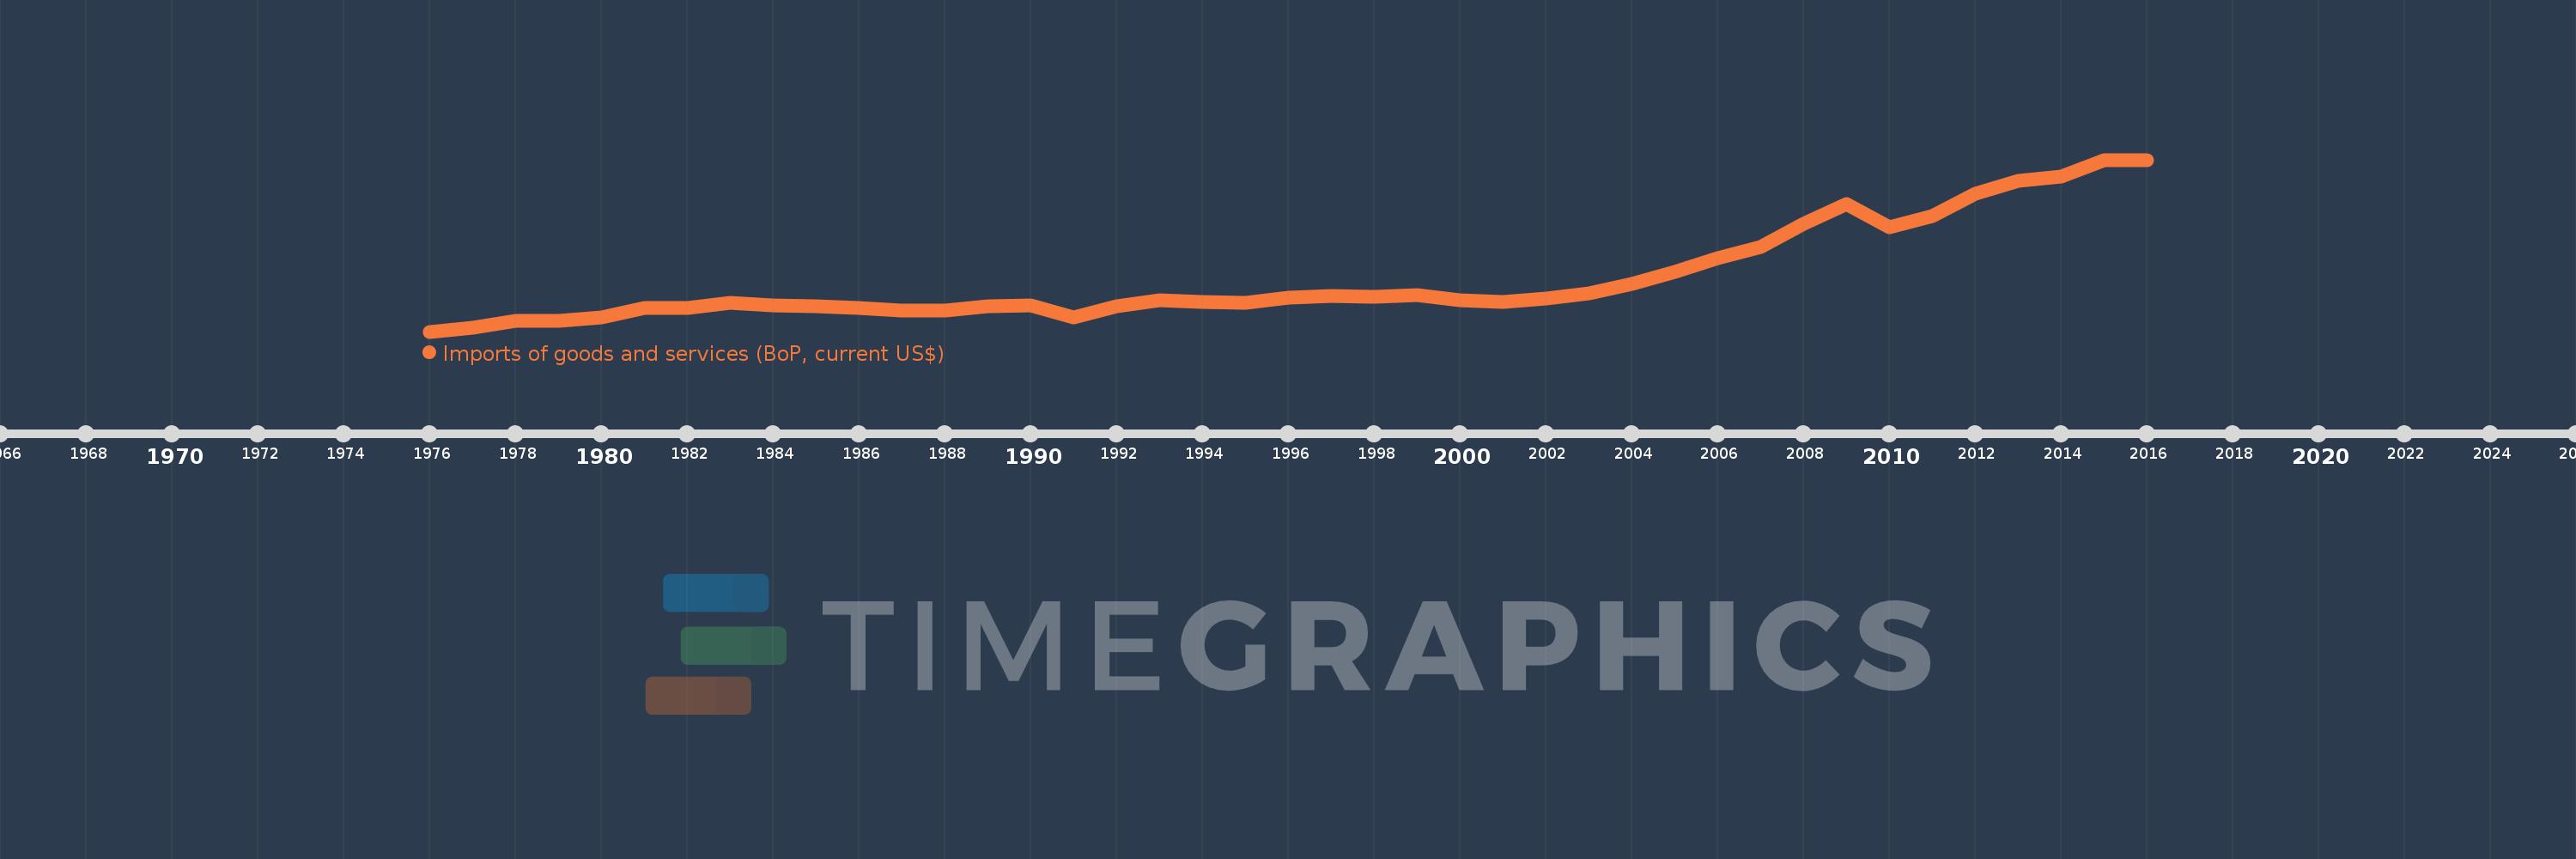
Imports of goods and services (BoP, current US$)
2016,2015,2014,2013,2012,2011,2010,2009,2008,2007,2006,2005,2004,2003,2002,2001,2000,1999,1998,1997,1996,1995,1994,1993,1992,1991,1990,1989,1988,1987,1986,1985,1984,1983,1982,1981,1980,1979,1978,1977,1976
Diese Statistik in anderen Ländern:
AfghanistanAlbaniaAlgeriaAngolaAntigua and BarbudaArab WorldArgentinaArmeniaArubaAustraliaAustriaAzerbaijanBahamas, TheBahrainBangladeshBarbadosBelarusBelgiumBelizeBeninBermudaBhutanBoliviaBosnia and HerzegovinaBotswanaBrazilBrunei DarussalamBulgariaBurkina FasoBurundiCabo VerdeCambodiaCameroonCanadaCaribbean small statesCentral African RepublicCentral Europe and the BalticsChadChileChinaColombiaComorosCongo, Dem. Rep.Congo, Rep.Costa RicaCote d'IvoireCroatiaCuracaoCyprusCzech RepublicDenmarkDjiboutiDominicaDominican RepublicEarly-demographic dividendEast Asia & PacificEast Asia & Pacific (excluding high income)East Asia & Pacific (IDA & IBRD countries)EcuadorEgypt, Arab Rep.El SalvadorEquatorial GuineaEritreaEstoniaEthiopiaEuro areaEurope & Central AsiaEurope & Central Asia (excluding high income)Europe & Central Asia (IDA & IBRD countries)European UnionFaroe IslandsFijiFinlandFragile and conflict affected situationsFranceFrench PolynesiaGabonGambia, TheGeorgiaGermanyGhanaGreeceGrenadaGuatemalaGuineaGuinea-BissauGuyanaHaitiHeavily indebted poor countries (HIPC)High incomeHondurasHong Kong SAR, ChinaHungaryIBRD onlyIcelandIDA & IBRD totalIDA blendIDA onlyIDA totalIndiaIndonesiaIran, Islamic Rep.IraqIrelandIsraelItalyJamaicaJapanJordanKazakhstanKenyaKiribatiKorea, Rep.KosovoKuwaitKyrgyz RepublicLao PDRLate-demographic dividendLatin America & Caribbean Latin America & Caribbean (excluding high income)Latin America & the Caribbean (IDA & IBRD countries)LatviaLeast developed countries: UN classificationLebanonLesothoLiberiaLibyaLithuaniaLow & middle incomeLow incomeLower middle incomeLuxembourgMacao SAR, ChinaMacedonia, FYRMadagascarMalawiMalaysiaMaldivesMaliMaltaMarshall IslandsMauritaniaMauritiusMexicoMicronesia, Fed. Sts.Middle East & North Africa (excluding high income)Middle East & North Africa (IDA & IBRD countries)Middle incomeMoldovaMongoliaMontenegroMoroccoMozambiqueMyanmarNamibiaNepalNetherlandsNew CaledoniaNicaraguaNigerNigeriaNorth AmericaNorwayOECD membersOmanOther small statesPacific island small statesPakistanPalauPanamaPapua New GuineaParaguayPeruPhilippinesPolandPortugalPost-demographic dividendPre-demographic dividendQatarRomaniaRussian FederationRwandaSamoaSao Tome and PrincipeSaudi ArabiaSenegalSerbiaSeychellesSierra LeoneSingaporeSint Maarten (Dutch part)Slovak RepublicSloveniaSmall statesSolomon IslandsSouth AfricaSouth AsiaSouth Asia (IDA & IBRD)South SudanSpainSri LankaSt. Kitts and NevisSt. LuciaSt. Vincent and the GrenadinesSub-Saharan Africa Sub-Saharan Africa (excluding high income)Sub-Saharan Africa (IDA & IBRD countries)SudanSurinameSwazilandSwedenSwitzerlandSyrian Arab RepublicTajikistanTanzaniaThailandTimor-LesteTogoTongaTrinidad and TobagoTunisiaTurkeyTuvaluUgandaUkraineUnited KingdomUnited StatesUpper middle incomeUruguayVanuatuVenezuela, RBVietnamWest Bank and GazaWorldYemen, Rep.ZambiaZimbabwe Zeitlinie:
Diese Zeitleiste vorliegt die Graphik ab 1976 J. bis 2016 J. Kuwait. Die Angaben bis 1975 J. sind nicht vorhanden. Die Zahl aktueller Beobachtungen nach Daten: 41.
Die Quelle (Bezeichnung):
Kennzahlen der Weltentwicklung
Die Quelle (Einrichtung):
International Monetary Fund, Balance of Payments Statistics Yearbook and data files.
Kategorien:
Economy & Growth, Trade
Es wurde aktualisiert:
23 Apr 2017 Jahr
Kennzahlen der Wertänderungen vom Jahr zum Jahr
im Durchschnitt:
18.116 Mlrd.
Minimum:
3.158 Mlrd.
1 Jan 1976 Jahr
Maximum:
51.171 Mlrd.
1 Jan 2015 Jahr
Zum Datum der Beobachtung
Wert
Absolute Veränderung
Die Veränderung bezüglich dem vorherigen Wert
1 Jan 1976 Jahr
3.158 Mlrd.
+3.158 Mlrd.
0.0%
1 Jan 1977 Jahr
4.275 Mlrd.
+1.117 Mlrd.
35.36%
1 Jan 1978 Jahr
6.142 Mlrd.
+1.867 Mlrd.
43.66%
1 Jan 1979 Jahr
6.181 Mlrd.
+38.941 Mln.
0.63%
1 Jan 1980 Jahr
7.135 Mlrd.
+954.831 Mln.
15.45%
1 Jan 1981 Jahr
9.823 Mlrd.
+2.687 Mlrd.
37.66%
1 Jan 1982 Jahr
9.642 Mlrd.
-180.686 Mln.
-1.84%
1 Jan 1983 Jahr
11.302 Mlrd.
+1.66 Mlrd.
17.22%
1 Jan 1984 Jahr
10.509 Mlrd.
-793.544 Mln.
-7.02%
1 Jan 1985 Jahr
10.255 Mlrd.
-253.948 Mln.
-2.42%
1 Jan 1986 Jahr
9.805 Mlrd.
-449.231 Mln.
-4.38%
1 Jan 1987 Jahr
9.126 Mlrd.
-679.267 Mln.
-6.93%
1 Jan 1988 Jahr
9.014 Mlrd.
-111.649 Mln.
-1.22%
1 Jan 1989 Jahr
10.203 Mlrd.
+1.189 Mlrd.
13.19%
1 Jan 1990 Jahr
10.528 Mlrd.
+325.076 Mln.
3.19%
1 Jan 1991 Jahr
7.169 Mlrd.
-3.359 Mlrd.
-31.91%
1 Jan 1992 Jahr
10.163 Mlrd.
+2.994 Mlrd.
41.76%
1 Jan 1993 Jahr
11.827 Mlrd.
+1.664 Mlrd.
16.38%
1 Jan 1994 Jahr
11.479 Mlrd.
-348.207 Mln.
-2.94%
1 Jan 1995 Jahr
11.1 Mlrd.
-379.128 Mln.
-3.3%
1 Jan 1996 Jahr
12.615 Mlrd.
+1.515 Mlrd.
13.65%
1 Jan 1997 Jahr
13.021 Mlrd.
+406.733 Mln.
3.22%
1 Jan 1998 Jahr
12.876 Mlrd.
-145.073 Mln.
-1.11%
1 Jan 1999 Jahr
13.26 Mlrd.
+384.195 Mln.
2.98%
1 Jan 2000 Jahr
11.88 Mlrd.
-1.381 Mlrd.
-10.41%
1 Jan 2001 Jahr
11.372 Mlrd.
-507.125 Mln.
-4.27%
1 Jan 2002 Jahr
12.402 Mlrd.
+1.029 Mlrd.
9.05%
1 Jan 2003 Jahr
13.955 Mlrd.
+1.553 Mlrd.
12.53%
1 Jan 2004 Jahr
16.495 Mlrd.
+2.54 Mlrd.
18.2%
1 Jan 2005 Jahr
19.898 Mlrd.
+3.402 Mlrd.
20.63%
1 Jan 2006 Jahr
23.768 Mlrd.
+3.871 Mlrd.
19.45%
1 Jan 2007 Jahr
26.878 Mlrd.
+3.11 Mlrd.
13.09%
1 Jan 2008 Jahr
33.306 Mlrd.
+6.427 Mlrd.
23.91%
1 Jan 2009 Jahr
38.717 Mlrd.
+5.411 Mlrd.
16.25%
1 Jan 2010 Jahr
32.271 Mlrd.
-6.445 Mlrd.
-16.65%
1 Jan 2011 Jahr
35.354 Mlrd.
+3.083 Mlrd.
9.55%
1 Jan 2012 Jahr
41.61 Mlrd.
+6.256 Mlrd.
17.7%
1 Jan 2013 Jahr
45.339 Mlrd.
+3.728 Mlrd.
8.96%
1 Jan 2014 Jahr
46.58 Mlrd.
+1.242 Mlrd.
2.74%
1 Jan 2015 Jahr
51.171 Mlrd.
+4.591 Mlrd.
9.86%
1 Jan 2016 Jahr
51.139 Mlrd.
-32.293 Mln.
-0.06%
Bewertung der Länder gemäß mit laufender Statistik nach Jahren


Kommentare: