29
/de/
de
AIzaSyAYiBZKx7MnpbEhh9jyipgxe19OcubqV5w
April 1, 2024
275804
United Kingdom
GBR
true
2
1
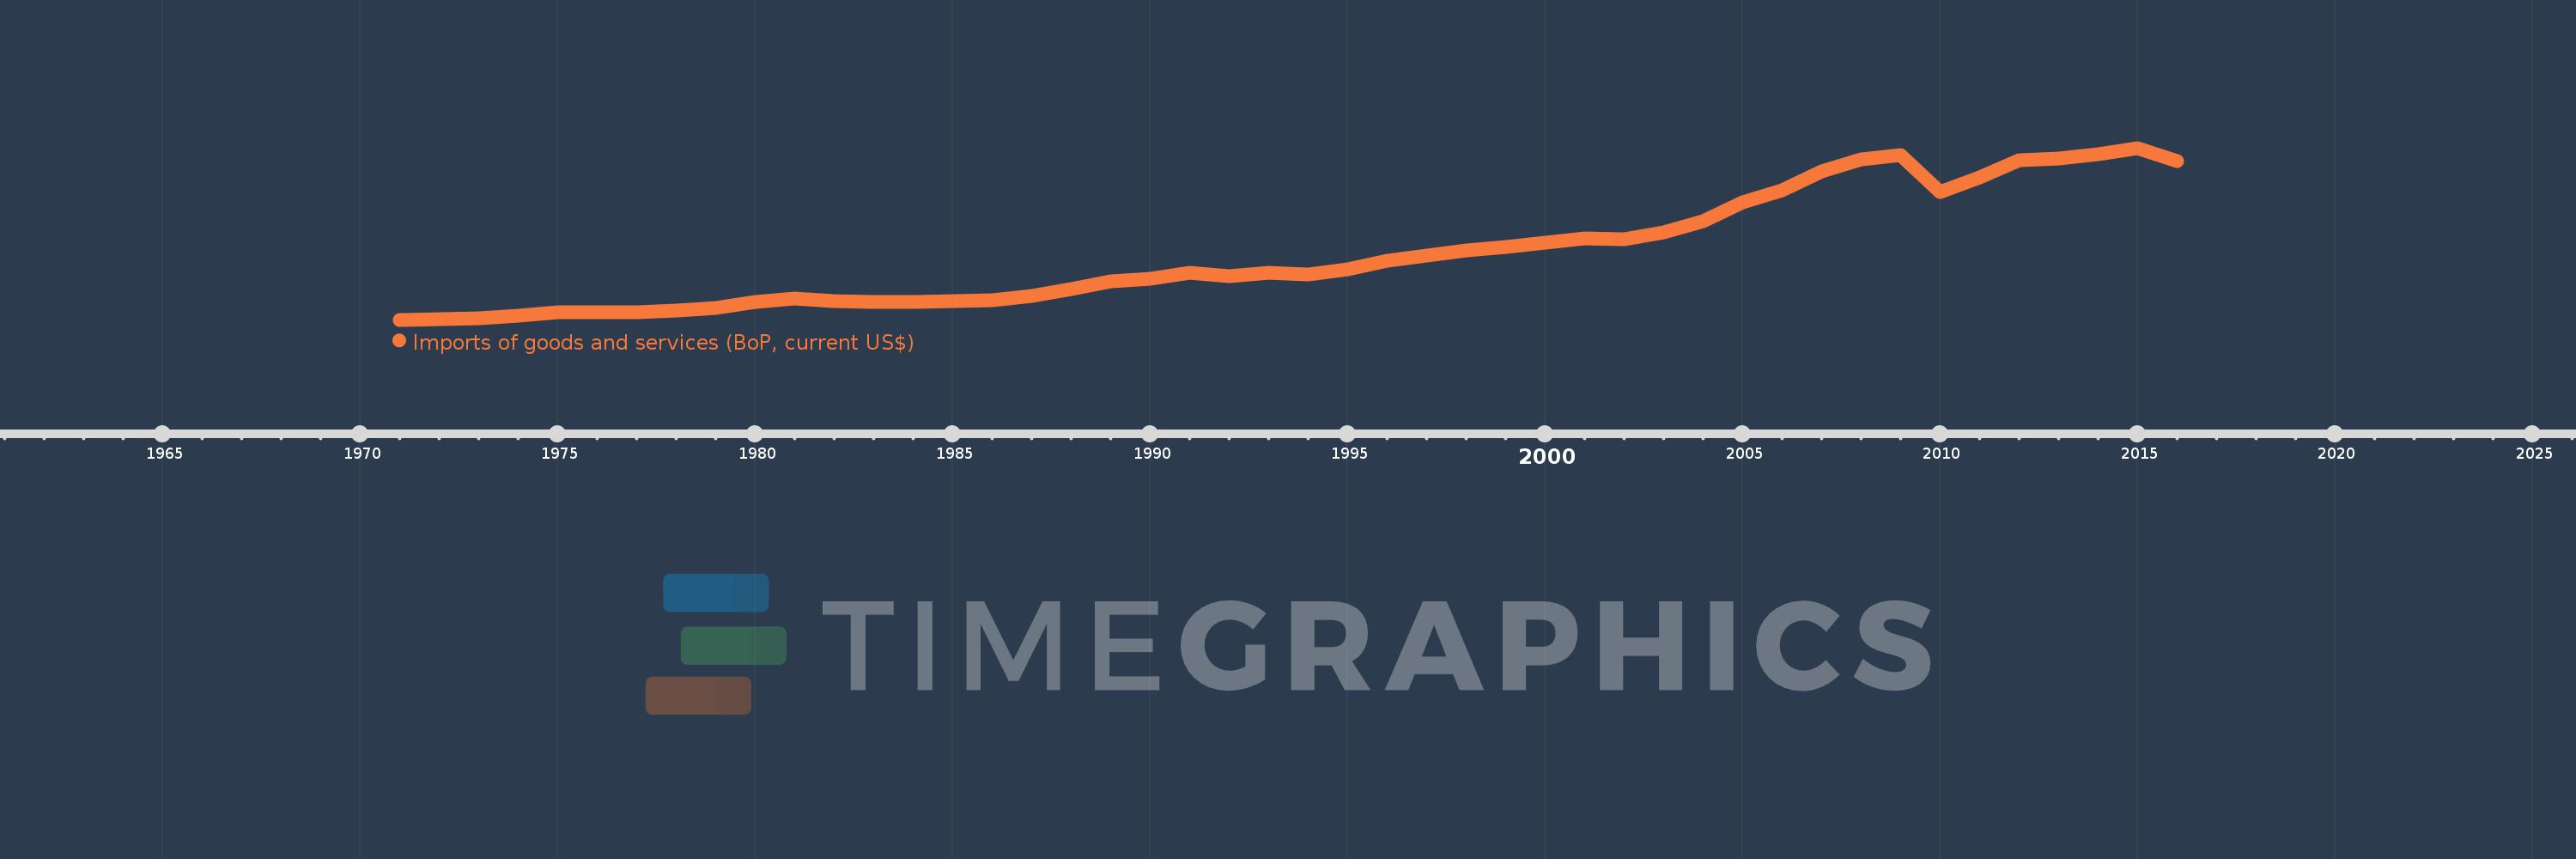
Imports of goods and services (BoP, current US$)
2016,2015,2014,2013,2012,2011,2010,2009,2008,2007,2006,2005,2004,2003,2002,2001,2000,1999,1998,1997,1996,1995,1994,1993,1992,1991,1990,1989,1988,1987,1986,1985,1984,1983,1982,1981,1980,1979,1978,1977,1976,1975,1974,1973,1972,1971
Diese Statistik in anderen Ländern:
AfghanistanAlbaniaAlgeriaAngolaAntigua and BarbudaArab WorldArgentinaArmeniaArubaAustraliaAustriaAzerbaijanBahamas, TheBahrainBangladeshBarbadosBelarusBelgiumBelizeBeninBermudaBhutanBoliviaBosnia and HerzegovinaBotswanaBrazilBrunei DarussalamBulgariaBurkina FasoBurundiCabo VerdeCambodiaCameroonCanadaCaribbean small statesCentral African RepublicCentral Europe and the BalticsChadChileChinaColombiaComorosCongo, Dem. Rep.Congo, Rep.Costa RicaCote d'IvoireCroatiaCuracaoCyprusCzech RepublicDenmarkDjiboutiDominicaDominican RepublicEarly-demographic dividendEast Asia & PacificEast Asia & Pacific (excluding high income)East Asia & Pacific (IDA & IBRD countries)EcuadorEgypt, Arab Rep.El SalvadorEquatorial GuineaEritreaEstoniaEthiopiaEuro areaEurope & Central AsiaEurope & Central Asia (excluding high income)Europe & Central Asia (IDA & IBRD countries)European UnionFaroe IslandsFijiFinlandFragile and conflict affected situationsFranceFrench PolynesiaGabonGambia, TheGeorgiaGermanyGhanaGreeceGrenadaGuatemalaGuineaGuinea-BissauGuyanaHaitiHeavily indebted poor countries (HIPC)High incomeHondurasHong Kong SAR, ChinaHungaryIBRD onlyIcelandIDA & IBRD totalIDA blendIDA onlyIDA totalIndiaIndonesiaIran, Islamic Rep.IraqIrelandIsraelItalyJamaicaJapanJordanKazakhstanKenyaKiribatiKorea, Rep.KosovoKuwaitKyrgyz RepublicLao PDRLate-demographic dividendLatin America & Caribbean Latin America & Caribbean (excluding high income)Latin America & the Caribbean (IDA & IBRD countries)LatviaLeast developed countries: UN classificationLebanonLesothoLiberiaLibyaLithuaniaLow & middle incomeLow incomeLower middle incomeLuxembourgMacao SAR, ChinaMacedonia, FYRMadagascarMalawiMalaysiaMaldivesMaliMaltaMarshall IslandsMauritaniaMauritiusMexicoMicronesia, Fed. Sts.Middle East & North Africa (excluding high income)Middle East & North Africa (IDA & IBRD countries)Middle incomeMoldovaMongoliaMontenegroMoroccoMozambiqueMyanmarNamibiaNepalNetherlandsNew CaledoniaNicaraguaNigerNigeriaNorth AmericaNorwayOECD membersOmanOther small statesPacific island small statesPakistanPalauPanamaPapua New GuineaParaguayPeruPhilippinesPolandPortugalPost-demographic dividendPre-demographic dividendQatarRomaniaRussian FederationRwandaSamoaSao Tome and PrincipeSaudi ArabiaSenegalSerbiaSeychellesSierra LeoneSingaporeSint Maarten (Dutch part)Slovak RepublicSloveniaSmall statesSolomon IslandsSouth AfricaSouth AsiaSouth Asia (IDA & IBRD)South SudanSpainSri LankaSt. Kitts and NevisSt. LuciaSt. Vincent and the GrenadinesSub-Saharan Africa Sub-Saharan Africa (excluding high income)Sub-Saharan Africa (IDA & IBRD countries)SudanSurinameSwazilandSwedenSwitzerlandSyrian Arab RepublicTajikistanTanzaniaThailandTimor-LesteTogoTongaTrinidad and TobagoTunisiaTurkeyTuvaluUgandaUkraineUnited KingdomUnited StatesUpper middle incomeUruguayVanuatuVenezuela, RBVietnamWest Bank and GazaWorldYemen, Rep.ZambiaZimbabwe Zeitlinie:
Diese Zeitleiste vorliegt die Graphik ab 1971 J. bis 2016 J. United Kingdom. Die Angaben bis 1970 J. sind nicht vorhanden. Die Zahl aktueller Beobachtungen nach Daten: 46.
Die Quelle (Bezeichnung):
Kennzahlen der Weltentwicklung
Die Quelle (Einrichtung):
International Monetary Fund, Balance of Payments Statistics Yearbook and data files.
Kategorien:
Economy & Growth, Trade
Es wurde aktualisiert:
23 Apr 2017 Jahr
Kennzahlen der Wertänderungen vom Jahr zum Jahr
im Durchschnitt:
363.991 Mlrd.
Minimum:
26.647 Mlrd.
1 Jan 1971 Jahr
Maximum:
901.765 Mlrd.
1 Jan 2015 Jahr
Zum Datum der Beobachtung
Wert
Absolute Veränderung
Die Veränderung bezüglich dem vorherigen Wert
1 Jan 1971 Jahr
26.647 Mlrd.
+26.647 Mlrd.
0.0%
1 Jan 1972 Jahr
29.607 Mlrd.
+2.96 Mlrd.
11.11%
1 Jan 1973 Jahr
34.301 Mlrd.
+4.694 Mlrd.
15.85%
1 Jan 1974 Jahr
46.395 Mlrd.
+12.094 Mlrd.
35.26%
1 Jan 1975 Jahr
63.537 Mlrd.
+17.142 Mlrd.
36.95%
1 Jan 1976 Jahr
63.811 Mlrd.
+273.616 Mln.
0.43%
1 Jan 1977 Jahr
65.708 Mlrd.
+1.897 Mlrd.
2.97%
1 Jan 1978 Jahr
73.948 Mlrd.
+8.24 Mlrd.
12.54%
1 Jan 1979 Jahr
87.057 Mlrd.
+13.109 Mlrd.
17.73%
1 Jan 1980 Jahr
115.424 Mlrd.
+28.367 Mlrd.
32.58%
1 Jan 1981 Jahr
134.2 Mlrd.
+18.776 Mlrd.
16.27%
1 Jan 1982 Jahr
121.504 Mlrd.
-12.696 Mlrd.
-9.46%
1 Jan 1983 Jahr
119.046 Mlrd.
-2.458 Mlrd.
-2.02%
1 Jan 1984 Jahr
117.61 Mlrd.
-1.436 Mlrd.
-1.21%
1 Jan 1985 Jahr
123.429 Mlrd.
+5.82 Mlrd.
4.95%
1 Jan 1986 Jahr
127.774 Mlrd.
+4.345 Mlrd.
3.52%
1 Jan 1987 Jahr
148.46 Mlrd.
+20.686 Mlrd.
16.19%
1 Jan 1988 Jahr
182.816 Mlrd.
+34.356 Mlrd.
23.14%
1 Jan 1989 Jahr
221.748 Mlrd.
+38.932 Mlrd.
21.3%
1 Jan 1990 Jahr
233.451 Mlrd.
+11.703 Mlrd.
5.28%
1 Jan 1991 Jahr
264.089 Mlrd.
+30.639 Mlrd.
13.12%
1 Jan 1992 Jahr
250.673 Mlrd.
-13.416 Mlrd.
-5.08%
1 Jan 1993 Jahr
267.221 Mlrd.
+16.548 Mlrd.
6.6%
1 Jan 1994 Jahr
255.267 Mlrd.
-11.954 Mlrd.
-4.47%
1 Jan 1995 Jahr
284.094 Mlrd.
+28.827 Mlrd.
11.29%
1 Jan 1996 Jahr
327.0 Mlrd.
+42.906 Mlrd.
15.1%
1 Jan 1997 Jahr
355.493 Mlrd.
+28.493 Mlrd.
8.71%
1 Jan 1998 Jahr
380.281 Mlrd.
+24.787 Mlrd.
6.97%
1 Jan 1999 Jahr
396.149 Mlrd.
+15.868 Mlrd.
4.17%
1 Jan 2000 Jahr
418.49 Mlrd.
+22.341 Mlrd.
5.64%
1 Jan 2001 Jahr
439.033 Mlrd.
+20.543 Mlrd.
4.91%
1 Jan 2002 Jahr
437.87 Mlrd.
-1.163 Mlrd.
-0.26%
1 Jan 2003 Jahr
470.144 Mlrd.
+32.273 Mlrd.
7.37%
1 Jan 2004 Jahr
528.76 Mlrd.
+58.616 Mlrd.
12.47%
1 Jan 2005 Jahr
625.785 Mlrd.
+97.025 Mlrd.
18.35%
1 Jan 2006 Jahr
686.471 Mlrd.
+60.686 Mlrd.
9.7%
1 Jan 2007 Jahr
783.684 Mlrd.
+97.212 Mlrd.
14.16%
1 Jan 2008 Jahr
842.392 Mlrd.
+58.708 Mlrd.
7.49%
1 Jan 2009 Jahr
867.516 Mlrd.
+25.124 Mlrd.
2.98%
1 Jan 2010 Jahr
677.171 Mlrd.
-190.345 Mlrd.
-21.94%
1 Jan 2011 Jahr
752.972 Mlrd.
+75.801 Mlrd.
11.19%
1 Jan 2012 Jahr
839.769 Mlrd.
+86.797 Mlrd.
11.53%
1 Jan 2013 Jahr
847.466 Mlrd.
+7.696 Mlrd.
0.92%
1 Jan 2014 Jahr
871.066 Mlrd.
+23.6 Mlrd.
2.78%
1 Jan 2015 Jahr
901.765 Mlrd.
+30.7 Mlrd.
3.52%
1 Jan 2016 Jahr
836.49 Mlrd.
-65.275 Mlrd.
-7.24%
Bewertung der Länder gemäß mit laufender Statistik nach Jahren


Kommentare: