29
/de/
de
AIzaSyAYiBZKx7MnpbEhh9jyipgxe19OcubqV5w
April 1, 2024
149249
Haiti
HTI
true
2
1
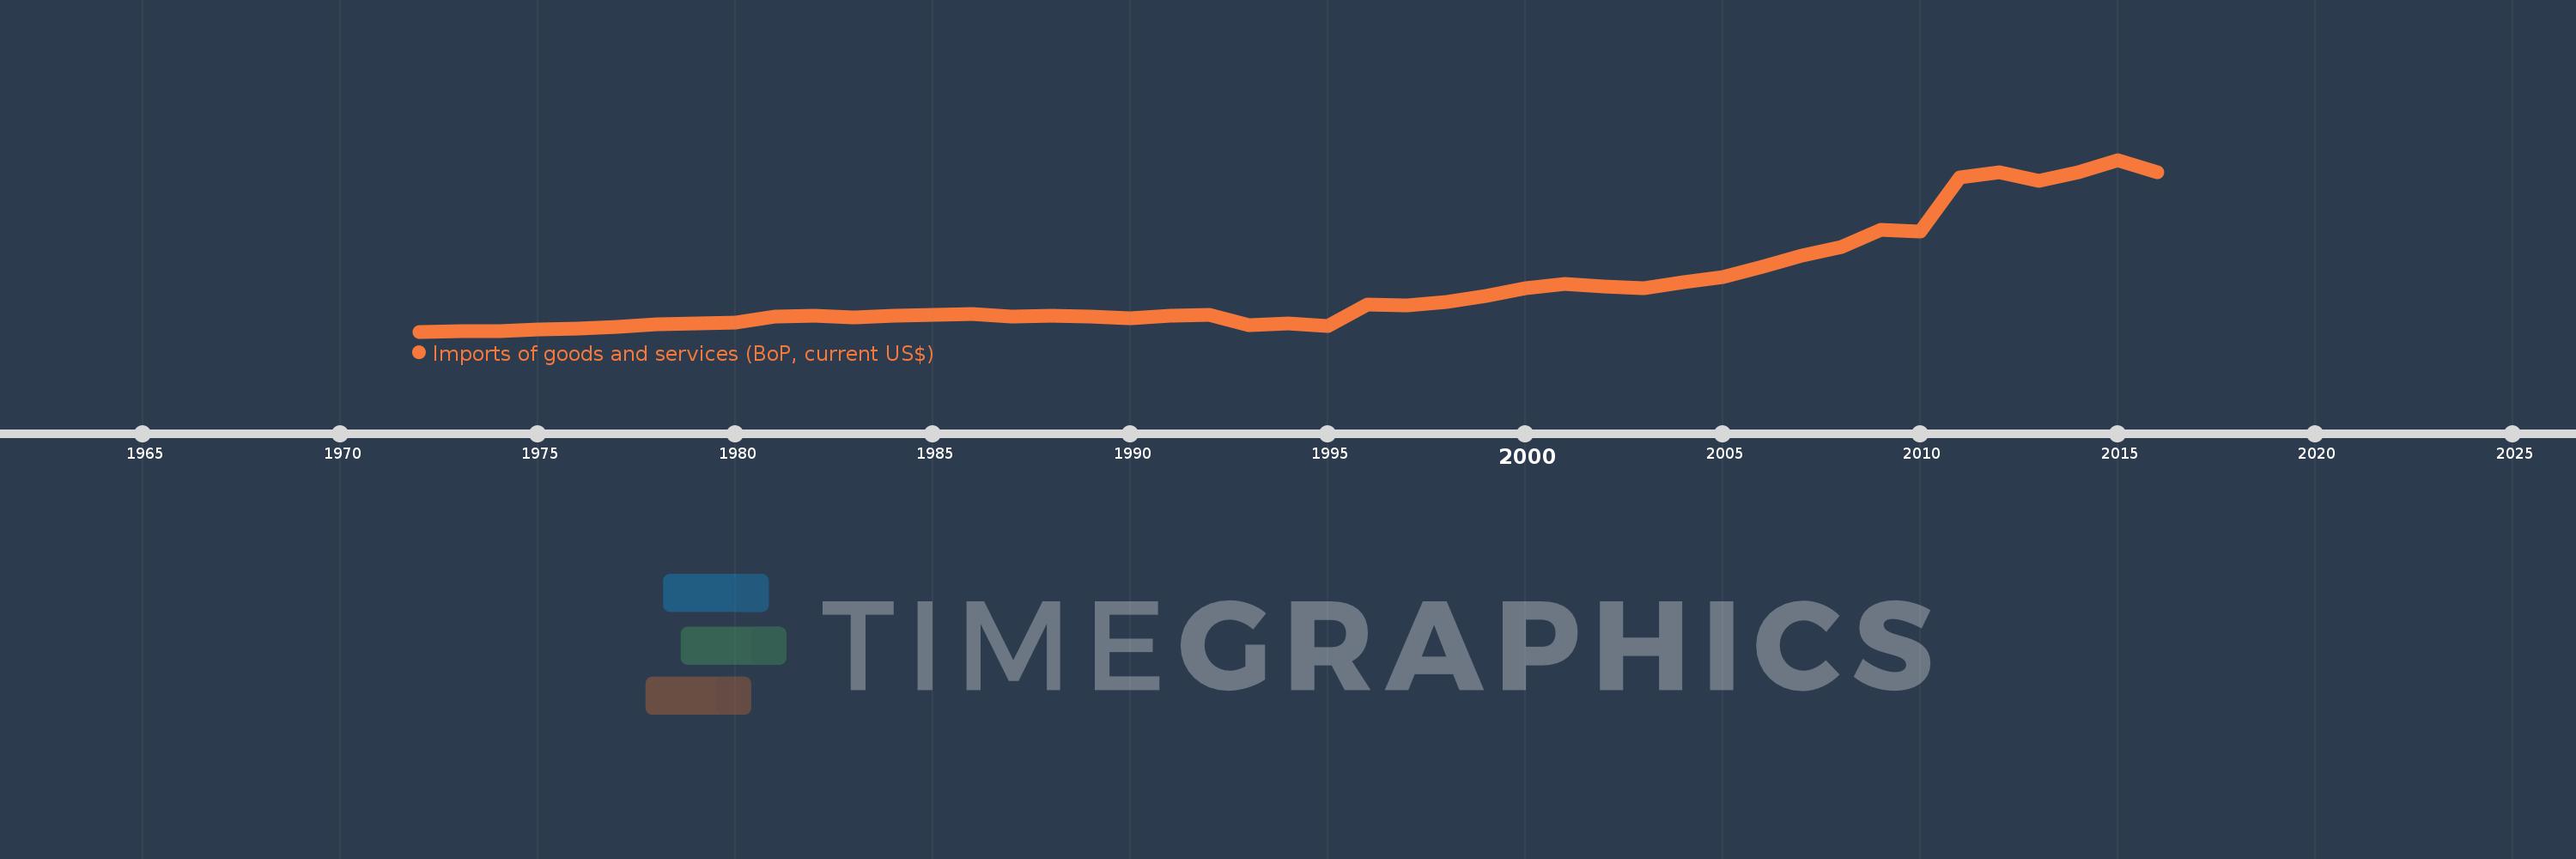
Imports of goods and services (BoP, current US$)
2016,2015,2014,2013,2012,2011,2010,2009,2008,2007,2006,2005,2004,2003,2002,2001,2000,1999,1998,1997,1996,1995,1994,1993,1992,1991,1990,1989,1988,1987,1986,1985,1984,1983,1982,1981,1980,1979,1978,1977,1976,1975,1974,1973,1972
Diese Statistik in anderen Ländern:
AfghanistanAlbaniaAlgeriaAngolaAntigua and BarbudaArab WorldArgentinaArmeniaArubaAustraliaAustriaAzerbaijanBahamas, TheBahrainBangladeshBarbadosBelarusBelgiumBelizeBeninBermudaBhutanBoliviaBosnia and HerzegovinaBotswanaBrazilBrunei DarussalamBulgariaBurkina FasoBurundiCabo VerdeCambodiaCameroonCanadaCaribbean small statesCentral African RepublicCentral Europe and the BalticsChadChileChinaColombiaComorosCongo, Dem. Rep.Congo, Rep.Costa RicaCote d'IvoireCroatiaCuracaoCyprusCzech RepublicDenmarkDjiboutiDominicaDominican RepublicEarly-demographic dividendEast Asia & PacificEast Asia & Pacific (excluding high income)East Asia & Pacific (IDA & IBRD countries)EcuadorEgypt, Arab Rep.El SalvadorEquatorial GuineaEritreaEstoniaEthiopiaEuro areaEurope & Central AsiaEurope & Central Asia (excluding high income)Europe & Central Asia (IDA & IBRD countries)European UnionFaroe IslandsFijiFinlandFragile and conflict affected situationsFranceFrench PolynesiaGabonGambia, TheGeorgiaGermanyGhanaGreeceGrenadaGuatemalaGuineaGuinea-BissauGuyanaHaitiHeavily indebted poor countries (HIPC)High incomeHondurasHong Kong SAR, ChinaHungaryIBRD onlyIcelandIDA & IBRD totalIDA blendIDA onlyIDA totalIndiaIndonesiaIran, Islamic Rep.IraqIrelandIsraelItalyJamaicaJapanJordanKazakhstanKenyaKiribatiKorea, Rep.KosovoKuwaitKyrgyz RepublicLao PDRLate-demographic dividendLatin America & Caribbean Latin America & Caribbean (excluding high income)Latin America & the Caribbean (IDA & IBRD countries)LatviaLeast developed countries: UN classificationLebanonLesothoLiberiaLibyaLithuaniaLow & middle incomeLow incomeLower middle incomeLuxembourgMacao SAR, ChinaMacedonia, FYRMadagascarMalawiMalaysiaMaldivesMaliMaltaMarshall IslandsMauritaniaMauritiusMexicoMicronesia, Fed. Sts.Middle East & North Africa (excluding high income)Middle East & North Africa (IDA & IBRD countries)Middle incomeMoldovaMongoliaMontenegroMoroccoMozambiqueMyanmarNamibiaNepalNetherlandsNew CaledoniaNicaraguaNigerNigeriaNorth AmericaNorwayOECD membersOmanOther small statesPacific island small statesPakistanPalauPanamaPapua New GuineaParaguayPeruPhilippinesPolandPortugalPost-demographic dividendPre-demographic dividendQatarRomaniaRussian FederationRwandaSamoaSao Tome and PrincipeSaudi ArabiaSenegalSerbiaSeychellesSierra LeoneSingaporeSint Maarten (Dutch part)Slovak RepublicSloveniaSmall statesSolomon IslandsSouth AfricaSouth AsiaSouth Asia (IDA & IBRD)South SudanSpainSri LankaSt. Kitts and NevisSt. LuciaSt. Vincent and the GrenadinesSub-Saharan Africa Sub-Saharan Africa (excluding high income)Sub-Saharan Africa (IDA & IBRD countries)SudanSurinameSwazilandSwedenSwitzerlandSyrian Arab RepublicTajikistanTanzaniaThailandTimor-LesteTogoTongaTrinidad and TobagoTunisiaTurkeyTuvaluUgandaUkraineUnited KingdomUnited StatesUpper middle incomeUruguayVanuatuVenezuela, RBVietnamWest Bank and GazaWorldYemen, Rep.ZambiaZimbabwe Zeitlinie:
Diese Zeitleiste vorliegt die Graphik ab 1972 J. bis 2016 J. Haiti. Die Angaben bis 1971 J. sind nicht vorhanden. Die Zahl aktueller Beobachtungen nach Daten: 45.
Die Quelle (Bezeichnung):
Kennzahlen der Weltentwicklung
Die Quelle (Einrichtung):
International Monetary Fund, Balance of Payments Statistics Yearbook and data files.
Kategorien:
Economy & Growth, Trade
Es wurde aktualisiert:
23 Apr 2017 Jahr
Kennzahlen der Wertänderungen vom Jahr zum Jahr
im Durchschnitt:
1.304 Mlrd.
Minimum:
74.94 Mln.
1 Jan 1972 Jahr
Maximum:
4.763 Mlrd.
1 Jan 2015 Jahr
Zum Datum der Beobachtung
Wert
Absolute Veränderung
Die Veränderung bezüglich dem vorherigen Wert
1 Jan 1972 Jahr
74.94 Mln.
+74.94 Mln.
0.0%
1 Jan 1973 Jahr
79.84 Mln.
+4.9 Mln.
6.54%
1 Jan 1974 Jahr
94.0 Mln.
+14.16 Mln.
17.74%
1 Jan 1975 Jahr
130.68 Mln.
+36.68 Mln.
39.02%
1 Jan 1976 Jahr
159.42 Mln.
+28.74 Mln.
21.99%
1 Jan 1977 Jahr
211.46 Mln.
+52.04 Mln.
32.64%
1 Jan 1978 Jahr
263.04 Mln.
+51.58 Mln.
24.39%
1 Jan 1979 Jahr
309.08 Mln.
+46.04 Mln.
17.5%
1 Jan 1980 Jahr
327.94 Mln.
+18.86 Mln.
6.1%
1 Jan 1981 Jahr
480.96 Mln.
+153.02 Mln.
46.66%
1 Jan 1982 Jahr
516.6 Mln.
+35.64 Mln.
7.41%
1 Jan 1983 Jahr
471.06 Mln.
-45.54 Mln.
-8.82%
1 Jan 1984 Jahr
497.22 Mln.
+26.16 Mln.
5.55%
1 Jan 1985 Jahr
526.96 Mln.
+29.74 Mln.
5.98%
1 Jan 1986 Jahr
557.08 Mln.
+30.12 Mln.
5.72%
1 Jan 1987 Jahr
473.48 Mln.
-83.6 Mln.
-15.01%
1 Jan 1988 Jahr
501.7 Mln.
+28.22 Mln.
5.96%
1 Jan 1989 Jahr
480.98 Mln.
-20.72 Mln.
-4.13%
1 Jan 1990 Jahr
448.1 Mln.
-32.88 Mln.
-6.84%
1 Jan 1991 Jahr
514.6 Mln.
+66.5 Mln.
14.84%
1 Jan 1992 Jahr
531.9 Mln.
+17.3 Mln.
3.36%
1 Jan 1993 Jahr
247.74 Mln.
-284.16 Mln.
-53.42%
1 Jan 1994 Jahr
290.7 Mln.
+42.96 Mln.
17.34%
1 Jan 1995 Jahr
235.38 Mln.
-55.32 Mln.
-19.03%
1 Jan 1996 Jahr
801.66 Mln.
+566.28 Mln.
240.58%
1 Jan 1997 Jahr
781.91 Mln.
-19.75 Mln.
-2.46%
1 Jan 1998 Jahr
891.1 Mln.
+109.19 Mln.
13.96%
1 Jan 1999 Jahr
1.041 Mlrd.
+149.41 Mln.
16.77%
1 Jan 2000 Jahr
1.252 Mlrd.
+211.61 Mln.
20.34%
1 Jan 2001 Jahr
1.369 Mlrd.
+116.6 Mln.
9.31%
1 Jan 2002 Jahr
1.316 Mlrd.
-52.83 Mln.
-3.86%
1 Jan 2003 Jahr
1.25 Mlrd.
-65.85 Mln.
-5.0%
1 Jan 2004 Jahr
1.417 Mlrd.
+166.95 Mln.
13.36%
1 Jan 2005 Jahr
1.562 Mlrd.
+144.56 Mln.
10.2%
1 Jan 2006 Jahr
1.853 Mlrd.
+291.33 Mln.
18.66%
1 Jan 2007 Jahr
2.142 Mlrd.
+288.68 Mln.
15.58%
1 Jan 2008 Jahr
2.384 Mlrd.
+242.89 Mln.
11.34%
1 Jan 2009 Jahr
2.854 Mlrd.
+469.324 Mln.
19.68%
1 Jan 2010 Jahr
2.804 Mlrd.
-49.556 Mln.
-1.74%
1 Jan 2011 Jahr
4.287 Mlrd.
+1.483 Mlrd.
52.89%
1 Jan 2012 Jahr
4.433 Mlrd.
+146.118 Mln.
3.41%
1 Jan 2013 Jahr
4.195 Mlrd.
-238.091 Mln.
-5.37%
1 Jan 2014 Jahr
4.419 Mlrd.
+224.083 Mln.
5.34%
1 Jan 2015 Jahr
4.763 Mlrd.
+343.114 Mln.
7.76%
1 Jan 2016 Jahr
4.432 Mlrd.
-330.849 Mln.
-6.95%
Bewertung der Länder gemäß mit laufender Statistik nach Jahren


Kommentare: