29
/de/
de
AIzaSyAYiBZKx7MnpbEhh9jyipgxe19OcubqV5w
April 1, 2024
161585
Italy
ITA
true
2
1
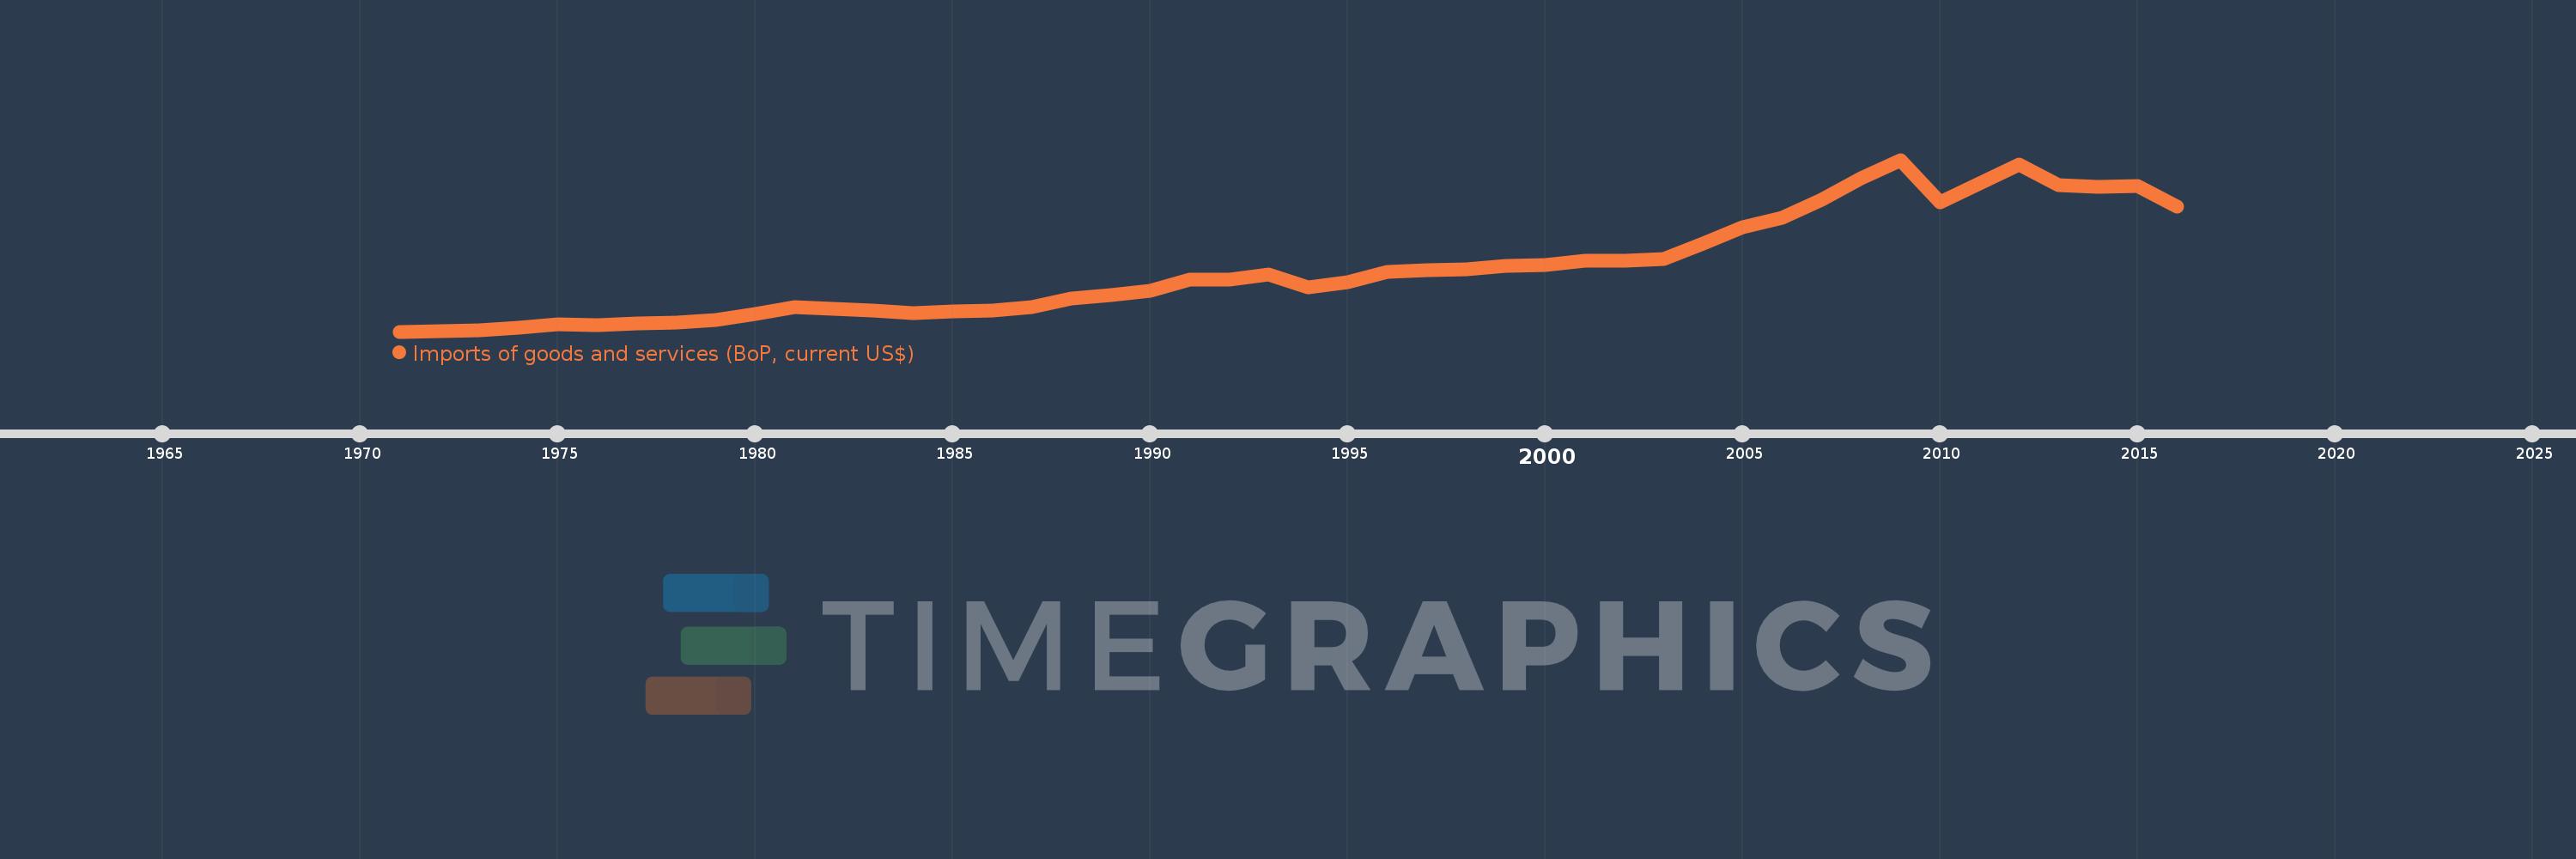
Imports of goods and services (BoP, current US$)
2016,2015,2014,2013,2012,2011,2010,2009,2008,2007,2006,2005,2004,2003,2002,2001,2000,1999,1998,1997,1996,1995,1994,1993,1992,1991,1990,1989,1988,1987,1986,1985,1984,1983,1982,1981,1980,1979,1978,1977,1976,1975,1974,1973,1972,1971
Diese Statistik in anderen Ländern:
AfghanistanAlbaniaAlgeriaAngolaAntigua and BarbudaArab WorldArgentinaArmeniaArubaAustraliaAustriaAzerbaijanBahamas, TheBahrainBangladeshBarbadosBelarusBelgiumBelizeBeninBermudaBhutanBoliviaBosnia and HerzegovinaBotswanaBrazilBrunei DarussalamBulgariaBurkina FasoBurundiCabo VerdeCambodiaCameroonCanadaCaribbean small statesCentral African RepublicCentral Europe and the BalticsChadChileChinaColombiaComorosCongo, Dem. Rep.Congo, Rep.Costa RicaCote d'IvoireCroatiaCuracaoCyprusCzech RepublicDenmarkDjiboutiDominicaDominican RepublicEarly-demographic dividendEast Asia & PacificEast Asia & Pacific (excluding high income)East Asia & Pacific (IDA & IBRD countries)EcuadorEgypt, Arab Rep.El SalvadorEquatorial GuineaEritreaEstoniaEthiopiaEuro areaEurope & Central AsiaEurope & Central Asia (excluding high income)Europe & Central Asia (IDA & IBRD countries)European UnionFaroe IslandsFijiFinlandFragile and conflict affected situationsFranceFrench PolynesiaGabonGambia, TheGeorgiaGermanyGhanaGreeceGrenadaGuatemalaGuineaGuinea-BissauGuyanaHaitiHeavily indebted poor countries (HIPC)High incomeHondurasHong Kong SAR, ChinaHungaryIBRD onlyIcelandIDA & IBRD totalIDA blendIDA onlyIDA totalIndiaIndonesiaIran, Islamic Rep.IraqIrelandIsraelItalyJamaicaJapanJordanKazakhstanKenyaKiribatiKorea, Rep.KosovoKuwaitKyrgyz RepublicLao PDRLate-demographic dividendLatin America & Caribbean Latin America & Caribbean (excluding high income)Latin America & the Caribbean (IDA & IBRD countries)LatviaLeast developed countries: UN classificationLebanonLesothoLiberiaLibyaLithuaniaLow & middle incomeLow incomeLower middle incomeLuxembourgMacao SAR, ChinaMacedonia, FYRMadagascarMalawiMalaysiaMaldivesMaliMaltaMarshall IslandsMauritaniaMauritiusMexicoMicronesia, Fed. Sts.Middle East & North Africa (excluding high income)Middle East & North Africa (IDA & IBRD countries)Middle incomeMoldovaMongoliaMontenegroMoroccoMozambiqueMyanmarNamibiaNepalNetherlandsNew CaledoniaNicaraguaNigerNigeriaNorth AmericaNorwayOECD membersOmanOther small statesPacific island small statesPakistanPalauPanamaPapua New GuineaParaguayPeruPhilippinesPolandPortugalPost-demographic dividendPre-demographic dividendQatarRomaniaRussian FederationRwandaSamoaSao Tome and PrincipeSaudi ArabiaSenegalSerbiaSeychellesSierra LeoneSingaporeSint Maarten (Dutch part)Slovak RepublicSloveniaSmall statesSolomon IslandsSouth AfricaSouth AsiaSouth Asia (IDA & IBRD)South SudanSpainSri LankaSt. Kitts and NevisSt. LuciaSt. Vincent and the GrenadinesSub-Saharan Africa Sub-Saharan Africa (excluding high income)Sub-Saharan Africa (IDA & IBRD countries)SudanSurinameSwazilandSwedenSwitzerlandSyrian Arab RepublicTajikistanTanzaniaThailandTimor-LesteTogoTongaTrinidad and TobagoTunisiaTurkeyTuvaluUgandaUkraineUnited KingdomUnited StatesUpper middle incomeUruguayVanuatuVenezuela, RBVietnamWest Bank and GazaWorldYemen, Rep.ZambiaZimbabwe Zeitlinie:
Diese Zeitleiste vorliegt die Graphik ab 1971 J. bis 2016 J. Italy. Die Angaben bis 1970 J. sind nicht vorhanden. Die Zahl aktueller Beobachtungen nach Daten: 46.
Die Quelle (Bezeichnung):
Kennzahlen der Weltentwicklung
Die Quelle (Einrichtung):
International Monetary Fund, Balance of Payments Statistics Yearbook and data files.
Kategorien:
Economy & Growth, Trade
Es wurde aktualisiert:
23 Apr 2017 Jahr
Kennzahlen der Wertänderungen vom Jahr zum Jahr
im Durchschnitt:
254.694 Mlrd.
Minimum:
16.984 Mlrd.
1 Jan 1971 Jahr
Maximum:
668.817 Mlrd.
1 Jan 2009 Jahr
Zum Datum der Beobachtung
Wert
Absolute Veränderung
Die Veränderung bezüglich dem vorherigen Wert
1 Jan 1971 Jahr
16.984 Mlrd.
+16.984 Mlrd.
0.0%
1 Jan 1972 Jahr
18.549 Mlrd.
+1.565 Mlrd.
9.22%
1 Jan 1973 Jahr
22.629 Mlrd.
+4.08 Mlrd.
22.0%
1 Jan 1974 Jahr
31.379 Mlrd.
+8.75 Mlrd.
38.67%
1 Jan 1975 Jahr
44.51 Mlrd.
+13.13 Mlrd.
41.84%
1 Jan 1976 Jahr
42.564 Mlrd.
-1.946 Mlrd.
-4.37%
1 Jan 1977 Jahr
47.462 Mlrd.
+4.898 Mlrd.
11.51%
1 Jan 1978 Jahr
52.777 Mlrd.
+5.315 Mlrd.
11.2%
1 Jan 1979 Jahr
61.95 Mlrd.
+9.173 Mlrd.
17.38%
1 Jan 1980 Jahr
84.043 Mlrd.
+22.092 Mlrd.
35.66%
1 Jan 1981 Jahr
108.582 Mlrd.
+24.54 Mlrd.
29.2%
1 Jan 1982 Jahr
101.746 Mlrd.
-6.837 Mlrd.
-6.3%
1 Jan 1983 Jahr
95.608 Mlrd.
-6.138 Mlrd.
-6.03%
1 Jan 1984 Jahr
87.735 Mlrd.
-7.873 Mlrd.
-8.23%
1 Jan 1985 Jahr
93.374 Mlrd.
+5.639 Mlrd.
6.43%
1 Jan 1986 Jahr
97.195 Mlrd.
+3.821 Mlrd.
4.09%
1 Jan 1987 Jahr
111.492 Mlrd.
+14.297 Mlrd.
14.71%
1 Jan 1988 Jahr
141.31 Mlrd.
+29.818 Mlrd.
26.74%
1 Jan 1989 Jahr
155.86 Mlrd.
+14.549 Mlrd.
10.3%
1 Jan 1990 Jahr
172.109 Mlrd.
+16.25 Mlrd.
10.43%
1 Jan 1991 Jahr
215.179 Mlrd.
+43.069 Mlrd.
25.02%
1 Jan 1992 Jahr
212.626 Mlrd.
-2.553 Mlrd.
-1.19%
1 Jan 1993 Jahr
232.435 Mlrd.
+19.809 Mlrd.
9.32%
1 Jan 1994 Jahr
185.413 Mlrd.
-47.022 Mlrd.
-20.23%
1 Jan 1995 Jahr
204.641 Mlrd.
+19.228 Mlrd.
10.37%
1 Jan 1996 Jahr
244.827 Mlrd.
+40.186 Mlrd.
19.64%
1 Jan 1997 Jahr
249.936 Mlrd.
+5.108 Mlrd.
2.09%
1 Jan 1998 Jahr
253.858 Mlrd.
+3.922 Mlrd.
1.57%
1 Jan 1999 Jahr
265.733 Mlrd.
+11.875 Mlrd.
4.68%
1 Jan 2000 Jahr
269.163 Mlrd.
+3.43 Mlrd.
1.29%
1 Jan 2001 Jahr
285.46 Mlrd.
+16.297 Mlrd.
6.05%
1 Jan 2002 Jahr
285.792 Mlrd.
+332.449 Mln.
0.12%
1 Jan 2003 Jahr
291.545 Mlrd.
+5.753 Mlrd.
2.01%
1 Jan 2004 Jahr
350.418 Mlrd.
+58.873 Mlrd.
20.19%
1 Jan 2005 Jahr
411.669 Mlrd.
+61.251 Mlrd.
17.48%
1 Jan 2006 Jahr
448.594 Mlrd.
+36.924 Mlrd.
8.97%
1 Jan 2007 Jahr
515.746 Mlrd.
+67.152 Mlrd.
14.97%
1 Jan 2008 Jahr
599.853 Mlrd.
+84.107 Mlrd.
16.31%
1 Jan 2009 Jahr
668.817 Mlrd.
+68.964 Mlrd.
11.5%
1 Jan 2010 Jahr
506.984 Mlrd.
-161.833 Mlrd.
-24.2%
1 Jan 2011 Jahr
577.628 Mlrd.
+70.644 Mlrd.
13.93%
1 Jan 2012 Jahr
651.14 Mlrd.
+73.513 Mlrd.
12.73%
1 Jan 2013 Jahr
572.325 Mlrd.
-78.816 Mlrd.
-12.1%
1 Jan 2014 Jahr
566.931 Mlrd.
-5.393 Mlrd.
-0.94%
1 Jan 2015 Jahr
569.946 Mlrd.
+3.014 Mlrd.
0.53%
1 Jan 2016 Jahr
491.404 Mlrd.
-78.542 Mlrd.
-13.78%
Bewertung der Länder gemäß mit laufender Statistik nach Jahren


Kommentare: