29
/de/
de
AIzaSyAYiBZKx7MnpbEhh9jyipgxe19OcubqV5w
April 1, 2024
150502
Honduras
HND
true
2
1
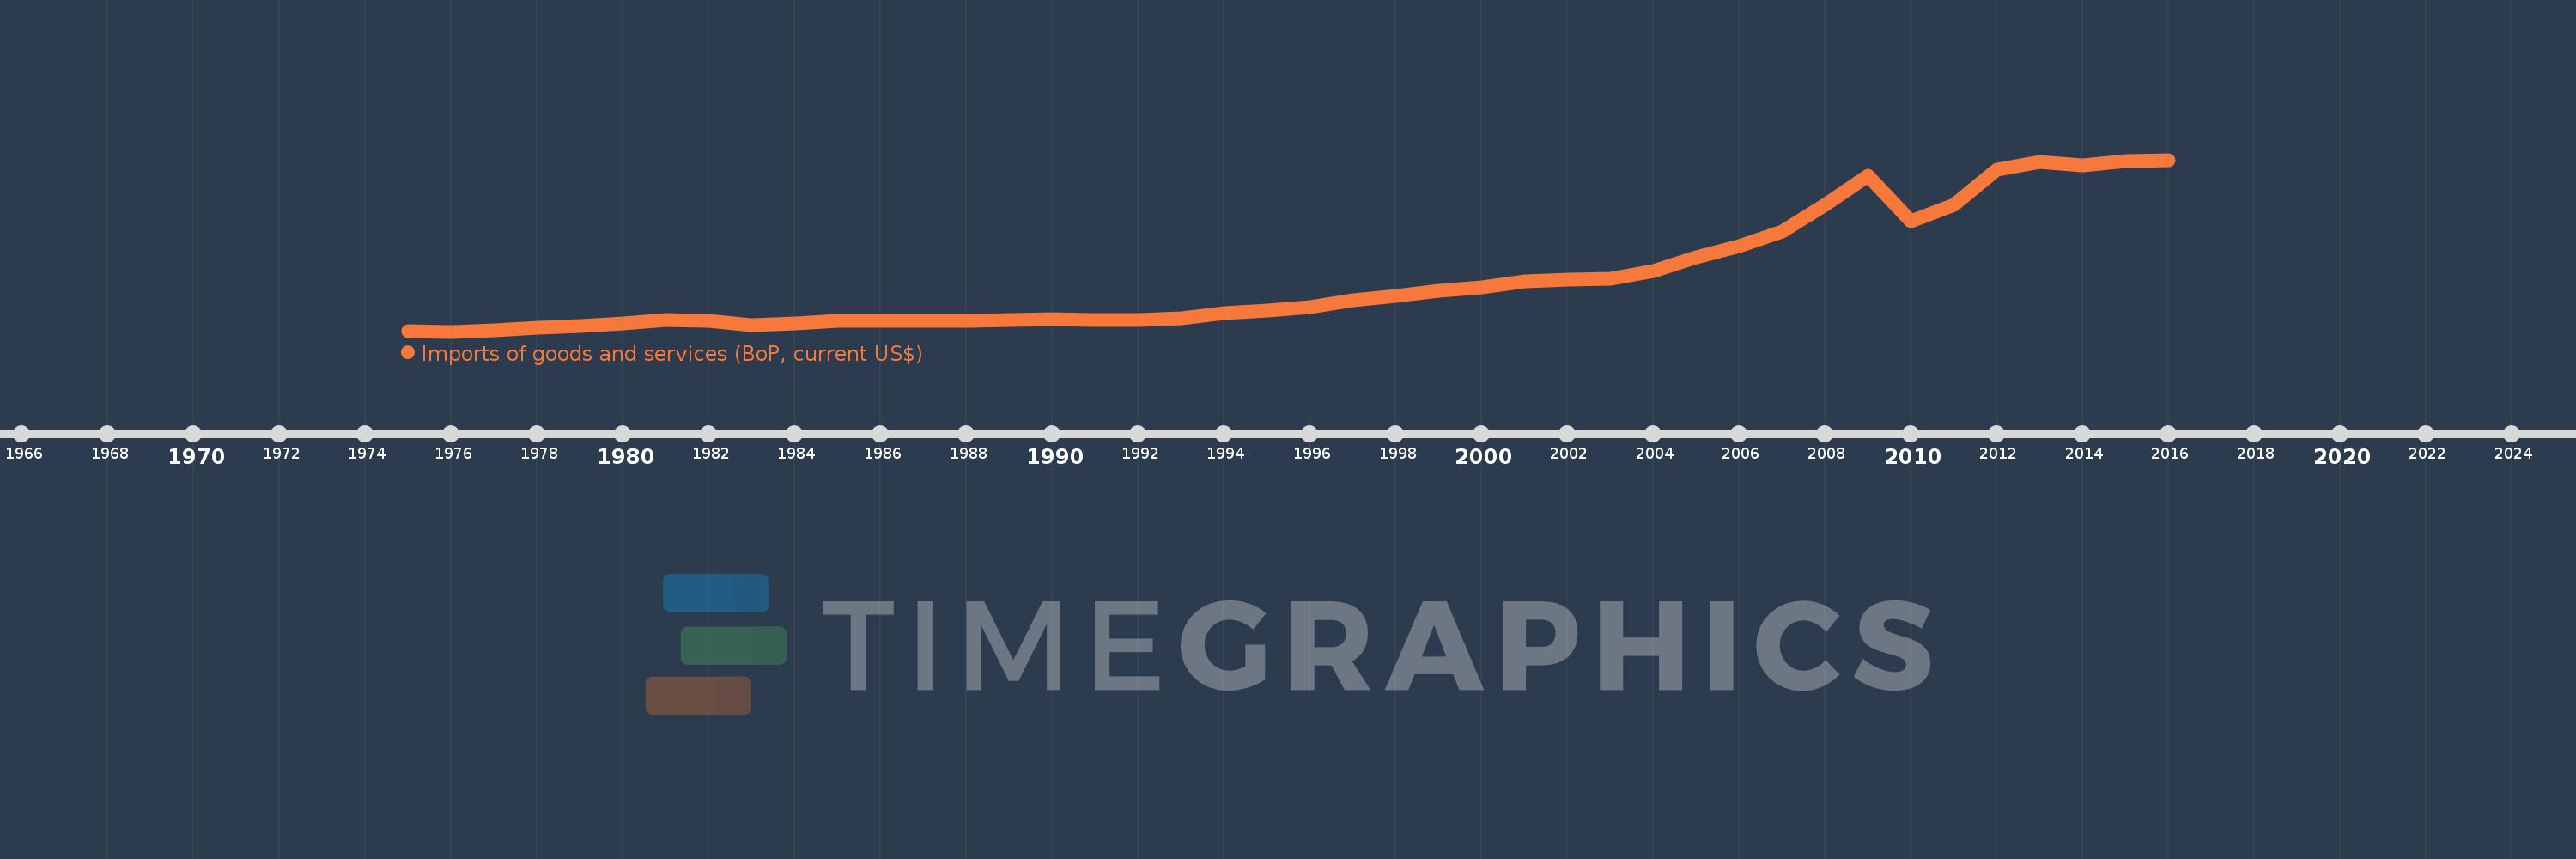
Imports of goods and services (BoP, current US$)
2016,2015,2014,2013,2012,2011,2010,2009,2008,2007,2006,2005,2004,2003,2002,2001,2000,1999,1998,1997,1996,1995,1994,1993,1992,1991,1990,1989,1988,1987,1986,1985,1984,1983,1982,1981,1980,1979,1978,1977,1976,1975
Diese Statistik in anderen Ländern:
AfghanistanAlbaniaAlgeriaAngolaAntigua and BarbudaArab WorldArgentinaArmeniaArubaAustraliaAustriaAzerbaijanBahamas, TheBahrainBangladeshBarbadosBelarusBelgiumBelizeBeninBermudaBhutanBoliviaBosnia and HerzegovinaBotswanaBrazilBrunei DarussalamBulgariaBurkina FasoBurundiCabo VerdeCambodiaCameroonCanadaCaribbean small statesCentral African RepublicCentral Europe and the BalticsChadChileChinaColombiaComorosCongo, Dem. Rep.Congo, Rep.Costa RicaCote d'IvoireCroatiaCuracaoCyprusCzech RepublicDenmarkDjiboutiDominicaDominican RepublicEarly-demographic dividendEast Asia & PacificEast Asia & Pacific (excluding high income)East Asia & Pacific (IDA & IBRD countries)EcuadorEgypt, Arab Rep.El SalvadorEquatorial GuineaEritreaEstoniaEthiopiaEuro areaEurope & Central AsiaEurope & Central Asia (excluding high income)Europe & Central Asia (IDA & IBRD countries)European UnionFaroe IslandsFijiFinlandFragile and conflict affected situationsFranceFrench PolynesiaGabonGambia, TheGeorgiaGermanyGhanaGreeceGrenadaGuatemalaGuineaGuinea-BissauGuyanaHaitiHeavily indebted poor countries (HIPC)High incomeHondurasHong Kong SAR, ChinaHungaryIBRD onlyIcelandIDA & IBRD totalIDA blendIDA onlyIDA totalIndiaIndonesiaIran, Islamic Rep.IraqIrelandIsraelItalyJamaicaJapanJordanKazakhstanKenyaKiribatiKorea, Rep.KosovoKuwaitKyrgyz RepublicLao PDRLate-demographic dividendLatin America & Caribbean Latin America & Caribbean (excluding high income)Latin America & the Caribbean (IDA & IBRD countries)LatviaLeast developed countries: UN classificationLebanonLesothoLiberiaLibyaLithuaniaLow & middle incomeLow incomeLower middle incomeLuxembourgMacao SAR, ChinaMacedonia, FYRMadagascarMalawiMalaysiaMaldivesMaliMaltaMarshall IslandsMauritaniaMauritiusMexicoMicronesia, Fed. Sts.Middle East & North Africa (excluding high income)Middle East & North Africa (IDA & IBRD countries)Middle incomeMoldovaMongoliaMontenegroMoroccoMozambiqueMyanmarNamibiaNepalNetherlandsNew CaledoniaNicaraguaNigerNigeriaNorth AmericaNorwayOECD membersOmanOther small statesPacific island small statesPakistanPalauPanamaPapua New GuineaParaguayPeruPhilippinesPolandPortugalPost-demographic dividendPre-demographic dividendQatarRomaniaRussian FederationRwandaSamoaSao Tome and PrincipeSaudi ArabiaSenegalSerbiaSeychellesSierra LeoneSingaporeSint Maarten (Dutch part)Slovak RepublicSloveniaSmall statesSolomon IslandsSouth AfricaSouth AsiaSouth Asia (IDA & IBRD)South SudanSpainSri LankaSt. Kitts and NevisSt. LuciaSt. Vincent and the GrenadinesSub-Saharan Africa Sub-Saharan Africa (excluding high income)Sub-Saharan Africa (IDA & IBRD countries)SudanSurinameSwazilandSwedenSwitzerlandSyrian Arab RepublicTajikistanTanzaniaThailandTimor-LesteTogoTongaTrinidad and TobagoTunisiaTurkeyTuvaluUgandaUkraineUnited KingdomUnited StatesUpper middle incomeUruguayVanuatuVenezuela, RBVietnamWest Bank and GazaWorldYemen, Rep.ZambiaZimbabwe Zeitlinie:
Diese Zeitleiste vorliegt die Graphik ab 1975 J. bis 2016 J. Honduras. Die Angaben bis 1974 J. sind nicht vorhanden. Die Zahl aktueller Beobachtungen nach Daten: 42.
Die Quelle (Bezeichnung):
Kennzahlen der Weltentwicklung
Die Quelle (Einrichtung):
International Monetary Fund, Balance of Payments Statistics Yearbook and data files.
Kategorien:
Economy & Growth, Trade
Es wurde aktualisiert:
23 Apr 2017 Jahr
Kennzahlen der Wertänderungen vom Jahr zum Jahr
im Durchschnitt:
3.494 Mlrd.
Minimum:
446.1 Mln.
1 Jan 1976 Jahr
Maximum:
10.377 Mlrd.
1 Jan 2016 Jahr
Zum Datum der Beobachtung
Wert
Absolute Veränderung
Die Veränderung bezüglich dem vorherigen Wert
1 Jan 1975 Jahr
455.8 Mln.
+455.8 Mln.
0.0%
1 Jan 1976 Jahr
446.1 Mln.
-9.7 Mln.
-2.13%
1 Jan 1977 Jahr
514.6 Mln.
+68.5 Mln.
15.36%
1 Jan 1978 Jahr
655.5 Mln.
+140.9 Mln.
27.38%
1 Jan 1979 Jahr
777.6 Mln.
+122.1 Mln.
18.63%
1 Jan 1980 Jahr
931.65 Mln.
+154.05 Mln.
19.81%
1 Jan 1981 Jahr
1.128 Mlrd.
+196.35 Mln.
21.08%
1 Jan 1982 Jahr
1.062 Mlrd.
-65.75 Mln.
-5.83%
1 Jan 1983 Jahr
824.95 Mln.
-237.3 Mln.
-22.34%
1 Jan 1984 Jahr
914.6 Mln.
+89.65 Mln.
10.87%
1 Jan 1985 Jahr
1.068 Mlrd.
+153.35 Mln.
16.77%
1 Jan 1986 Jahr
1.087 Mlrd.
+19.05 Mln.
1.78%
1 Jan 1987 Jahr
1.078 Mlrd.
-8.9 Mln.
-0.82%
1 Jan 1988 Jahr
1.074 Mlrd.
-4.27 Mln.
-0.4%
1 Jan 1989 Jahr
1.141 Mlrd.
+67.07 Mln.
6.25%
1 Jan 1990 Jahr
1.186 Mlrd.
+45.3 Mln.
3.97%
1 Jan 1991 Jahr
1.127 Mlrd.
-59.4 Mln.
-5.01%
1 Jan 1992 Jahr
1.139 Mlrd.
+12.4 Mln.
1.1%
1 Jan 1993 Jahr
1.233 Mlrd.
+94.2 Mln.
8.27%
1 Jan 1994 Jahr
1.498 Mlrd.
+264.4 Mln.
21.44%
1 Jan 1995 Jahr
1.662 Mlrd.
+164.3 Mln.
10.97%
1 Jan 1996 Jahr
1.852 Mlrd.
+190.2 Mln.
11.44%
1 Jan 1997 Jahr
2.254 Mlrd.
+401.3 Mln.
21.66%
1 Jan 1998 Jahr
2.511 Mlrd.
+257.7 Mln.
11.44%
1 Jan 1999 Jahr
2.817 Mlrd.
+306.0 Mln.
12.18%
1 Jan 2000 Jahr
3.012 Mlrd.
+194.7 Mln.
6.91%
1 Jan 2001 Jahr
3.374 Mlrd.
+361.783 Mln.
12.01%
1 Jan 2002 Jahr
3.474 Mlrd.
+99.896 Mln.
2.96%
1 Jan 2003 Jahr
3.505 Mlrd.
+31.406 Mln.
0.9%
1 Jan 2004 Jahr
3.935 Mlrd.
+429.846 Mln.
12.26%
1 Jan 2005 Jahr
4.735 Mlrd.
+800.086 Mln.
20.33%
1 Jan 2006 Jahr
5.397 Mlrd.
+662.472 Mln.
13.99%
1 Jan 2007 Jahr
6.255 Mlrd.
+857.268 Mln.
15.88%
1 Jan 2008 Jahr
7.776 Mlrd.
+1.522 Mlrd.
24.33%
1 Jan 2009 Jahr
9.448 Mlrd.
+1.671 Mlrd.
21.49%
1 Jan 2010 Jahr
6.81 Mlrd.
-2.638 Mlrd.
-27.92%
1 Jan 2011 Jahr
7.775 Mlrd.
+965.581 Mln.
14.18%
1 Jan 2012 Jahr
9.804 Mlrd.
+2.029 Mlrd.
26.09%
1 Jan 2013 Jahr
10.27 Mlrd.
+466.031 Mln.
4.75%
1 Jan 2014 Jahr
10.074 Mlrd.
-196.206 Mln.
-1.91%
1 Jan 2015 Jahr
10.293 Mlrd.
+219.144 Mln.
2.18%
1 Jan 2016 Jahr
10.377 Mlrd.
+83.808 Mln.
0.81%
Bewertung der Länder gemäß mit laufender Statistik nach Jahren


Kommentare: